Main Content

ROS Data Analyzer

Visualize messages from live ROS or ROS 2 topics and bag files

Since R2023a

Description

The ROS Data Analyzer app allows you to visualize messages from live ROS or ROS 2 topics and bag files. Within the app, you can create multiple viewers to simultaneously visualize different ROS or ROS 2 messages from a live topic or a bag file. Additionally, you can assign a unique tag to any ROS or ROS 2 bag file, serving as an identifier for that file. The app also enables you to bookmark specific events when reviewing messages from a bag file. You can then search any bag file by filtering through tags, bookmarks, or the types of visualizers used, and export this data for further analysis.

You can open the following viewers using the app, which support the given message types in the table.

Types of Viewer

ViewerViewer IconInterfaceDescription
Image ViewerImage Viewer Icon

Image viewer in ROS Bag Viewer App

  1. Load a bag file containing sensor_msgs/Image or sensor_msgs/CompressedImage message type.

  2. Select Image Viewer from the toolstrip and choose the data source from the drop down to visualize the image.

  3. Use the top-right corner options to zoom in and out, and pan the image in all directions.

Point Cloud ViewerPoint cloud Viewer Icon

Point Cloud Viewer in ROS Bag Viewer App

  1. Load a bag file containing sensor_msgs/PointCloud2 message type.

  2. Select Point Cloud Viewer from the toolstrip and choose the data source from the drop down to visualize the point cloud message.

  3. Use the top-right corner options to zoom in and out, pan, and rotate the message in 3D.

Laser Scan ViewerLaser Scan Viewer Icon

Laser Scan Viewer of the ROS Bag Viewer App

  1. Load a bag file containing sensor_msgs/LaserScan message type.

  2. Select Laser Scan Viewer from the toolstrip and choose the data source from the drop down to visualize the laser scan message.

  3. Use the options on the top to zoom in and out, pan, and rotate the message 3D.

Odometry ViewerOdometry Viewer Icon

Odometry Viewer of the ROS Bag Viewer App

  1. Load a bag file containing nav_msgs/Odometry message type.

  2. Select Odometry Viewer from the toolstrip and choose the data source from the drop down to visualize the odometry message.

  3. See the indicator to view the instantaneous location of the robot in the trajectory.

  4. Use the top-right corner options to zoom in and out, and pan in all directions.

XY Plot ViewerXY Plot Viewer Icon

XY Plot Viewer of ROS BAG Viewer App

  1. Load a bag file containing geometry_msgs/Point or nav_msgs/Odometry message type.

  2. Select XY Plot Viewer from the toolstrip and choose the data source from the drop down to visualize how the numeric message field changes across the XY axes.

  3. See the indicator to view the instantaneous location of the robot across the XY axes.

  4. Use the top-right corner options to zoom in and out, and pan in all directions.

Time Plot ViewerTime Plot Icon

Time Plot Viewer of ROS BAG Viewer App

  1. Load a bag file containing geometry_msgs/Point or nav_msgs/Odometry message type.

  2. Select Time Plot Viewer from the toolstrip and choose the data source from the drop down to visualize how the numeric message field changes with respect to time.

  3. See the indicator to view the instantaneous location of the robot.

  4. Use the top-right corner options to zoom in and out, and pan in all directions.

Message ViewerMessage viewer Icon

Message Viewer of the ROS Bag Viewer App

  1. Load a bag file containing any message type.

  2. Select Message Viewer from the toolstrip and choose the data source from the drop down to visualize the raw message stored in the rosbag.

Map Viewer

Map Viewer Icon

Map Viewer of the ROS Bag Viewer App

  1. Load a bag file containing sensor_msgs/NavSatFix or gps_common/GPSFix message types.

  2. Select Map Viewer from the toolstrip and choose the data source from the drop down to visualize the GPS message.

  3. See the indicator to view the instantaneous location of the GPS coordinate in the trajectory.

  4. Use the top-right corner options to zoom in and out, and pan in all directions.

Marker Viewer

Marker Viewer Icon

Marker Viewer of the ROS Bag Viewer App

  1. Load a bag file containing visualization_msgs/Marker or visualization_msgs/MarkerArray message types.

  2. Select Marker Viewer from the toolstrip and choose the data source from the drop down to visualize the marker message. Also, specify the frame ID which you want to be the global frame for marker visualization.

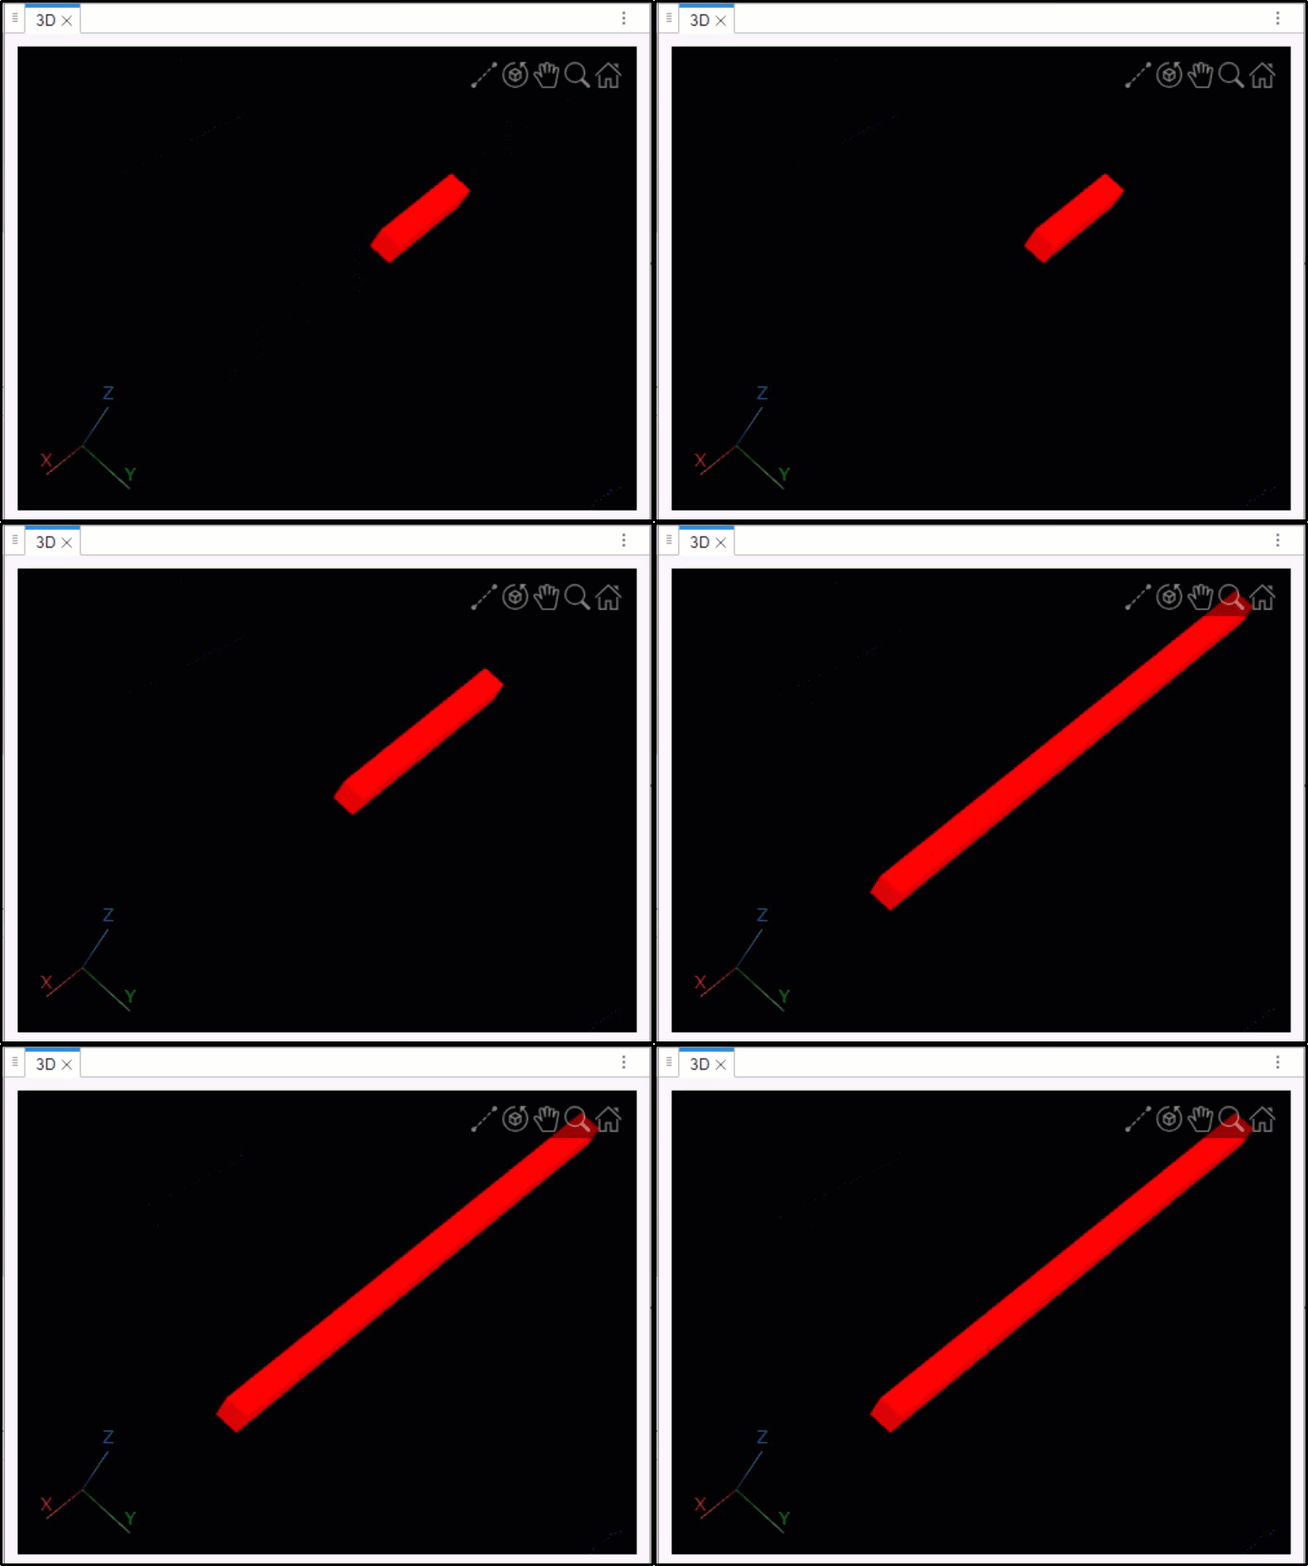
  3. Use the top-right corner options to zoom in and out, pan, and rotate the message in 3D.

  4. From the Tools section on the app toolstrip, you can:

    • Toggle the marker visualizer view between 2-D and 3-D axes.

    • Select two marker points and measure distance between them. Use the data tips option in the top-right corner to select the two points of interest.

For each viewer, you can filter the supported messages in the bag file for visualization. You can fast forward, and rewind based on the message timestamp or elapsed time while playing the bag file. You can also pause, and play the bag frame-by-frame. The app also displays information about the bag file contents after loading the bag file. You can also save a snapshot of the visualization window at any particular instance of time.

ROS Data Analyzer App Interface

Open the ROS Data Analyzer App

  • MATLAB® Toolstrip: On the Apps tab, under Robotics and Autonomous Systems, click the app icon ROS Bag Viewer app icon.

  • MATLAB command prompt: Enter rosDataAnalyzer.

Programmatic Use

expand all

rosDataAnalyzer opens the ROS Data Analyzer app, which enables you to visualize messages in a ROS or ROS 2 bag file.

Version History

Introduced in R2023a

expand all

Go to top of page