pattern
Description
pat = pattern(tx)tx. The signal gain value (in dBi) in a particular direction
determines the color of the pattern. The function scales the pattern on the plot according
to the Size name-value
argument. The function plots the pattern for the transmitter frequency as specified by the
Frequency property of tx.
pat = pattern(___,Name,Value)'ColorMap','jet'
specifies the jet colormap for coloring the pattern plot.
Examples
Set up the satellite scenario.
startTime = datetime(2021,2,12,13,30,0);
stopTime = startTime + hours(5);
sampleTime = 60;                                      %seconds
sc = satelliteScenario(startTime,stopTime,sampleTime);
Create a satellite, ground station, transmitter, and receiver.
sat = satellite(sc,1e7,0,0,0,0,0);
gs = groundStation(sc,"Latitude",30,"Longitude",74);
tx = transmitter(sat,"Frequency",3e9);
rx = receiver(gs);
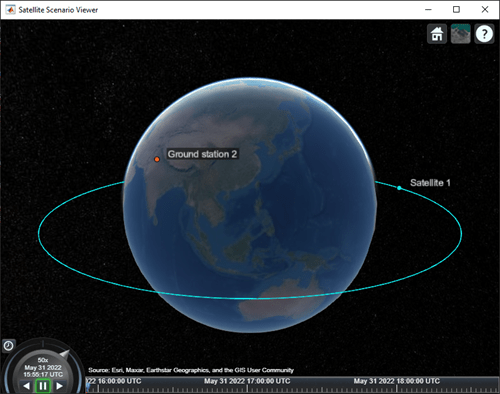
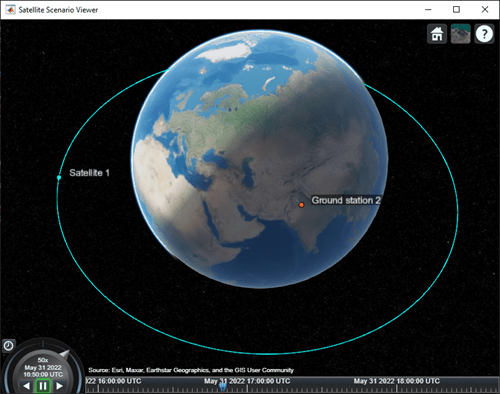
Visualize the scenario in the satellite scenario viewer.
viewer = satelliteScenarioViewer(sc);
![]()
Plot the radiation pattern of the transmitter antenna.
pat = pattern(tx);
![]()
Point the satellite at the ground station. The pattern rotates to reflect the new orientation of the antenna.
pointAt(sat,gs);
![]()
Increase the visual size of the radiation pattern.
pat.Size = 3000000;
pat.Colormap = "parula";![]()
Set up the satellite scenario.
sc = satelliteScenario;
Create a satellite, ground station, transmitter, and receiver.
sat = satellite(sc,1e7,0,0,0,0,0);
gs = groundStation(sc,"Latitude",30,"Longitude",74);
tx = transmitter(sat,"Frequency",1e9);
rx = receiver(gs,MountingAngles=[0;180;0]);
Visualize the scenario in the satellite scenario viewer.
viewer = satelliteScenarioViewer(sc);
Plot the radiation pattern of the receiver antenna.
freq = 30e9;
pat = pattern(rx,freq);
Increase the visual size and specify the transparency of the radiation pattern.
pat.Size = 3000000;
pat.Colormap = 'autumn';
Input Arguments
Name-Value Arguments
Output Arguments
Version History
Introduced in R2021b