Main Content

plot

Plot TDR response

Since R2025a

    Description

    plot(tdrObj) plots time-domain reflectometry (TDR) response in units of impedance from a tdr object specified in tdrObj.

    example

    plot(tdrObj,Name=Value) plots TDR response using one or more name-value pair arguments. For example, Type='voltage' plots the TDR response in units of voltage (V).

    example

    Examples

    collapse all

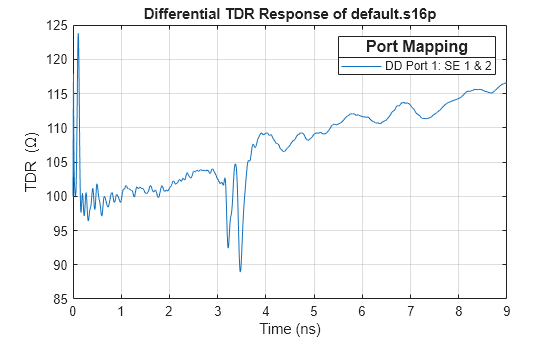
    Use a 16-port S-parameter Touchstone file to plot the TDR response of a differential port pair located at port 1 and 2.

    First, create a structure to define the rational fitting parameters. These parameters enable you to control the rational fitting process for complex S-parameters.

    rationalOptions = struct('Tolerance',-30,'MaxPoles',500);

    Create a TDR object with the differential port pair set to 1 and 2.

    tdrObj = tdr('default.s16p',...
        ConvertToDifferential=true, ...
        Ports=[1 2],...
        EndTime=9e-9,...
        RiseTime=10e-12,...
        SampleTime=5e-12, ...
        RationalOptions=rationalOptions);

    Plot the differential TDR response of the differential port pair 1 and 2.

    plot(tdrObj)

    Figure contains an axes object. The axes object with title Differential TDR Response of default.s16p, xlabel Time (ns), ylabel TDR (\Omega) contains an object of type line. This object represents DD Port 1: SE 1 & 2.

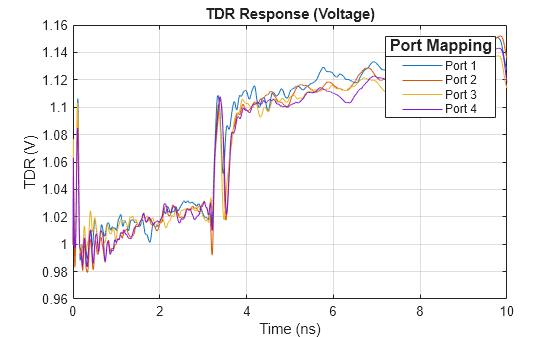
    Create a TDR object from a 4-port Touchstone file.

    tdrObj = tdr('default.s4p');

    Plot the single-ended TDR of a 4-port S-parameter in units of impedance.

    plot(tdrObj)

    Figure contains an axes object. The axes object with title Single Ended TDR Response of default.s4p, xlabel Time (ns), ylabel TDR (\Omega) contains 4 objects of type line. These objects represent Port 1, Port 2, Port 3, Port 4.

    Plot the single-ended TDR of a 4-port S-parameter in units of voltage.

    plot(tdrObj, Type="voltage", Title="TDR Response (Voltage)")

    Figure contains an axes object. The axes object with title TDR Response (Voltage), xlabel Time (ns), ylabel TDR (V) contains 4 objects of type line. These objects represent Port 1, Port 2, Port 3, Port 4.

    Plot the single-ended TDR of a 4-port S-parameter with respect to velocity of propagation of the medium. Scale the X-axis of this response in meters.

    plot(tdrObj,Vp=3e8/2,Title="TDR Response(m)")

    Figure contains an axes object. The axes object with title TDR Response(m), xlabel (m), ylabel TDR (\Omega) contains 4 objects of type line. These objects represent Port 1, Port 2, Port 3, Port 4.

    Create a TDR table that displays the time and voltage TDR values for all the ports specified in the TDR object.

    T = createTDRTable(tdrObj,tdrType='voltage')
    T=10000×5 table
        Time (s)    Port 1 (V)    Port 2 (V)    Port 3 (V)    Port 4 (V)
        ________    __________    __________    __________    __________
    
              0            1             1             1             1  
          1e-12       1.0062       0.99943        1.0126        1.0087  
          2e-12        1.012       0.99992        1.0237        1.0168  
          3e-12       1.0175        1.0013        1.0335        1.0243  
          4e-12       1.0228        1.0035        1.0421        1.0312  
          5e-12       1.0278        1.0063        1.0498        1.0376  
          6e-12       1.0324        1.0097        1.0565        1.0436  
          7e-12       1.0369        1.0135        1.0625        1.0491  
          8e-12        1.041        1.0175        1.0678        1.0541  
          9e-12       1.0449        1.0218        1.0726        1.0587  
          1e-11       1.0485        1.0263        1.0769         1.063  
        1.1e-11       1.0457        1.0313        1.0682        1.0582  
        1.2e-11        1.043        1.0353        1.0606        1.0536  
        1.3e-11       1.0404        1.0382        1.0542        1.0494  
        1.4e-11       1.0378        1.0402        1.0487        1.0453  
        1.5e-11       1.0353        1.0414         1.044        1.0415  
          ⋮


    Input Arguments

    collapse all

    Time-domain reflectometry object, specified as a tdr object.

    Name-Value Arguments

    collapse all

    Specify optional pairs of arguments as Name1=Value1,...,NameN=ValueN, where Name is the argument name and Value is the corresponding value. Name-value arguments must appear after other arguments, but the order of the pairs does not matter.

    Example: Type='reflectionCoefficient'

    Y-axis units in a TDR response plot, specified as one of these:

    • 'impedance' — Plot the TDR response in units of impedance (ohms).

    • 'reflectionCoefficient' — Plot the TDR response in units of reflection coefficient (no units).

    • 'voltage — Plot the TDR response in units of voltage (V).

    Example: 'reflectionCoefficient'

    Custom title for the TDR response plot, specified as a string or a character vector.

    Example: TDR Response

    Velocity of propagation of the medium in the TDR response plot, specified as a scalar in m/s. Use this argument to change the X-axis of the TDR response to distance.

    The upper limit of this argument is the speed of light, 3e8 m/s.

    Example: 1.5e8

    Version History

    Introduced in R2025a