bandpower
Band power
Syntax
Description
p = bandpower(pxx,f,"psd")pxx. The integral is approximated by the
rectangle method. The input f is a vector of frequencies
corresponding to the PSD estimates in pxx. The
"psd" option indicates that the input is a PSD estimate
and not time series data.
p = bandpower(pxx,f,freqRange,"psd")freqRange. If the frequencies in
freqRange do not match values in
f, the closest values are used. The average power is
computed by integrating the power spectral density (PSD) estimate
pxx. The integral is approximated by the rectangle
method. The "psd" option indicates the input is a PSD
estimate and not time series data.
Examples
Create a signal consisting of a 100 Hz sine wave in additive N(0,1) white Gaussian noise. The sample rate is 1 kHz. Determine the average power and compare it against the norm.
t = 0:0.001:1-0.001;
x = cos(2*pi*100*t) + randn(size(t));

p = bandpower(x)
p =
1.5264
l2norm = norm(x,2)^2/numel(x)
l2norm =
1.5264
Determine the percentage of total power in specified frequency intervals.
Create a signal consisting of a 100 Hz sine wave and a chirp signal with frequency content between 220 Hz and 270 Hz, all in additive N(0,1) white Gaussian noise. The sample rate is 1 kHz. Reset the random number generator for reproducible results.
rng("default")

t = 0:0.001:1-0.001;
x = cos(2*pi*100*t) + t.*chirp(t,220,t(end),270) + 0.2*randn(size(t));
Determine the percentage of total power in the frequency intervals between 50 Hz and 150 Hz and between 200 Hz and 300 Hz.
powBands = bandpower(x,1000,[50 150;200 300]);
powTotal = bandpower(x,1000,[0 500]);
powPercent = 100*(powBands/powTotal)
powPercent = 2×1

   76.0390
   20.6880
Determine the average power by first computing a PSD estimate using the periodogram. Input the PSD estimate to bandpower.
Create a signal consisting of a 100 Hz sine wave in additive N(0,1) white Gaussian noise. The sample rate is 1 kHz. Obtain the periodogram and use the 'psd' flag to compute the average power using the PSD estimate. Compare the result against the average power computed in the time domain.
t = 0:0.001:1-0.001;
Fs = 1000;
x = cos(2*pi*100*t) + randn(size(t));

[Pxx,F] = periodogram(x,rectwin(length(x)),length(x),Fs);
p = bandpower(Pxx,F,"psd")
p = 1.5264
avpow = norm(x,2)^2/numel(x)
avpow =
1.5264
Determine the percentage of total power in specified frequency intervals using the periodogram as the input.
Create a signal consisting of a 100 Hz sine wave and a chirp signal with frequency content between 220 Hz and 270 Hz, all in additive N(0,1) white Gaussian noise. The sample rate is 1 kHz. Obtain the periodogram and the corresponding frequency vector. Reset the random number generator for reproducible results. Plot the periodogram of the signal.
rng("default")

Fs = 1000;
t = 0:1/Fs:1-0.001;
x = cos(2*pi*100*t) + t.*chirp(t,220,t(end),270) + 0.2*randn(size(t));

[Pxx,F] = periodogram(x,hamming(length(x)),length(x),Fs);
periodogram(x,hamming(length(x)),length(x),Fs)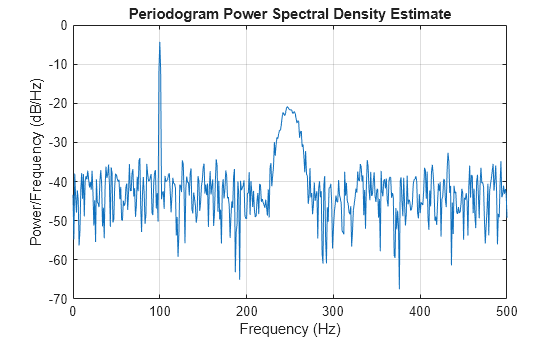
Using the PSD estimate, determine the percentage of total power in the frequency intervals between 50 Hz and 150 Hz and between 200 Hz and 300 Hz.
powBands = bandpower(Pxx,F,[50 150;200 300],"psd");
powTotal = bandpower(Pxx,F,[0 500],"psd");
powPercent = 100*(powBands/powTotal)
powPercent = 2×1

   76.0390
   20.6880
Create a multichannel signal consisting of three sinusoids in additive N(0,1) white Gaussian noise. The sinusoids' frequencies are 100 Hz, 200 Hz, and 300 Hz. The sample rate is 1 kHz, and the signal has a duration of 1 s.
Fs = 1000;
t = 0:1/Fs:1-1/Fs;
f = [100;200;300];

x = cos(2*pi*f*t)' + randn(length(t),3);
Determine the average power of the signal and compare it to the norm.
p = bandpower(x)
p = 1×3

    1.5264    1.5382    1.4717
l2norm = dot(x,x)/length(x)
l2norm = 1×3

    1.5264    1.5382    1.4717
Input Arguments
Output Arguments
Algorithms
To determine the band power, bandpower computes a periodogram
power spectrum estimate using a Hamming window.
You can obtain the same value of band power, bPow, over the
frequency interval [fMin fMax] from a signal
x at a sample rate Fs in these three
ways.
| Directly from the signal |
bPow = bandpower(x,Fs,[fMin fMax]) |
| From the periodogram of the signal |
[P,F] = periodogram(x,hamming(length(x)),length(x),Fs); bPow = bandpower(P,F,[fMin fMax],"psd") |
| From the power spectral estimate (Welch's PSD) of the signal |
[P,F] = pwelch(x,hamming(length(x)),[],length(x),Fs); bPow = bandpower(P,F,[fMin fMax],"psd") |
Note
Because bandpower uses an intermediary representation
to transform the input signal from the time domain to frequency domain, the
returned band power might vary, depending on the signal transformation method,
number of DFT points, and window size.
References
[1] Hayes, Monson H. Statistical Digital Signal Processing and Modeling. New York: John Wiley & Sons, 1996.
[2] Stoica, Petre, and Randolph Moses. Spectral Analysis of Signals. Upper Saddle River, NJ: Prentice Hall, 2005.
Extended Capabilities
Version History
Introduced in R2013aSee Also
periodogram | sfdr | powerbw | obw