Main Content

deepSignalAnomalyDetectorCNN

Detect signal anomalies using 1-D convolutional autoencoder

Since R2023a

    Description

    The deepSignalAnomalyDetectorCNN object uses a 1-D convolutional autoencoder model to detect signal anomalies.

    Creation

    Create a deepSignalAnomalyDetectorCNN object using deepSignalAnomalyDetector and specifying "convautoencoder" as the model type.

    Properties

    expand all

    General

    This property is read-only.

    Training status, returned as 0 (false) or 1 (true). Once you train the detector, IsTrained is equal to 1.

    Data Types: logical

    This property is read-only.

    Number of channels in each input signal, returned as a positive integer.

    Data Types: single | double | int8 | int16 | int32 | int64 | uint8 | uint16 | uint32 | uint64

    Model

    This property is read-only.

    Type of deep learning model implemented by the detector, returned as "convautoencoder".

    This property is read-only.

    Number of convolutional layers in the downsampling section of the model, returned as a positive integer.

    The model uses the same number of transposed convolutional layers in the upsampling section, with the parameters in reverse order.

    Data Types: single | double | int8 | int16 | int32 | int64 | uint8 | uint16 | uint32 | uint64

    This property is read-only.

    Downsampling factor, returned as a positive integer or a vector of positive integers. When DownsampleFactor is a scalar, each layer uses the same downsampling factor. When DownsampleFactor is a vector, the ith layer uses a downsampling factor equal to the value of the ith element in the vector.

    Data Types: single | double | int8 | int16 | int32 | int64 | uint8 | uint16 | uint32 | uint64

    This property is read-only.

    Number of filters in downsampling convolution layers, returned as a positive scalar integer or a vector of positive integers.

    Data Types: single | double | int8 | int16 | int32 | int64 | uint8 | uint16 | uint32 | uint64

    This property is read-only.

    Size of filters in downsampling convolution layers, returned as a positive scalar integer or a vector of positive integers.

    Data Types: single | double | int8 | int16 | int32 | int64 | uint8 | uint16 | uint32 | uint64

    This property is read-only.

    Dropout probability used to avoid overfitting, returned as a nonnegative scalar less than 1.

    Data Types: single | double | int8 | int16 | int32 | int64 | uint8 | uint16 | uint32 | uint64

    Window

    This property is read-only.

    Window length of each signal segment, returned as a positive integer or as "fullSignal".

    • If WindowLength is an integer, the detector divides each input signal into segments. The length of each segment is equal to the WindowLength value in samples.

    • If WindowLength is "fullSignal", the detector treats each input signal as a single segment.

    Use updateDetector to modify this and other window properties.

    Data Types: single | double | int8 | int16 | int32 | int64 | uint8 | uint16 | uint32 | uint64 | char | string

    This property is read-only.

    Number of overlapped samples between window segments, returned as a positive integer or as "auto".

    • If OverlapLength is a positive integer, the detector sets the number of overlapped samples equal to the OverlapLength value.

    • If OverlapLength is "auto", the detector sets the number of overlapped samples equal to WindowLength – 1.

    Data Types: single | double | int8 | int16 | int32 | int64 | uint8 | uint16 | uint32 | uint64 | char | string

    This property is read-only.

    Method to aggregate sample loss within each window segment, returned as one of these:

    • "max" — Compute the aggregated window loss as the maximum value of all the sample losses within the window.

    • "mean" — Compute the aggregated window loss as the mean value of all the sample losses within the window.

    • "median" — Compute the aggregated window loss as the median value of all the sample losses within the window.

    • "min" — Compute the aggregated window loss as the minimum value of all the sample losses within the window.

    Data Types: char | string

    Threshold

    This property is read-only.

    Method to compute the detection threshold, returned as one of these:

    • "contaminationFraction" — Value corresponding to the detection of anomalies within a specified fraction of windows. The fraction value is specified by ThresholdParameter.

    • "max" — Maximum window loss measured over the entire training data set and multiplied by ThresholdParameter.

    • "median" — Median window loss measured over the entire training data set and multiplied by ThresholdParameter.

    • "mean" — Mean window loss measured over the entire training data set and multiplied by ThresholdParameter.

    • "manual" — Manual detection threshold value based on Threshold.

    • "customFunction" — Custom detection threshold value based on ThresholdFunction.

    Use updateDetector to modify this and other threshold properties.

    Data Types: char | string

    This property is read-only.

    Detection threshold, returned as a nonnegative scalar when you set ThresholdMethod to "contaminationFraction", and as positive scalar when you set ThresholdMethod to "max", "median", or "mean".

    Data Types: single | double | int8 | int16 | int32 | int64 | uint8 | uint16 | uint32 | uint64

    This property is read-only.

    Manual detection threshold, retuned as a positive scalar. This property applies only when you set ThresholdMethod to "manual".

    Data Types: single | double | int8 | int16 | int32 | int64 | uint8 | uint16 | uint32 | uint64

    This property is read-only.

    Function to compute custom detection threshold, returned as a function handle. This property applies only when you set ThresholdMethod to "customFunction".

    Data Types: function_handle

    Object Functions

    detectDetect anomalies in signals
    getModelGet underlying neural network model of signal anomaly detector
    plotAnomaliesPlot signal anomalies
    plotLossPlot window reconstruction loss
    plotLossDistributionPlot CDF and histogram of aggregated window loss distribution
    saveModelSave detector network and parameters
    trainDetectorTrain signal anomaly detector
    updateDetectorUpdate settings of trained detector and recompute detection threshold

    Examples

    collapse all

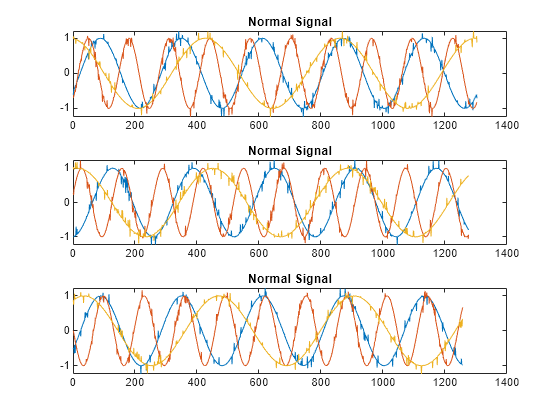
    Load the file sineWaveAnomalyData.mat, which contains two sets of synthetic three-channel sinusoidal signals.

    sineWaveNormal contains 10 sinusoids of stable frequency and amplitude. Each signal has a series of small-amplitude impact-like imperfections. The signals have different lengths and initial phases. Plot the first three normal signals.

    load sineWaveAnomalyData.mat
    sl = 3;
    
    tiledlayout("vertical")
    ax = zeros(sl,1);
    for kj = 1:sl
        ax(kj) = nexttile;
        plot(sineWaveNormal{kj})
        title("Normal Signal")
    end

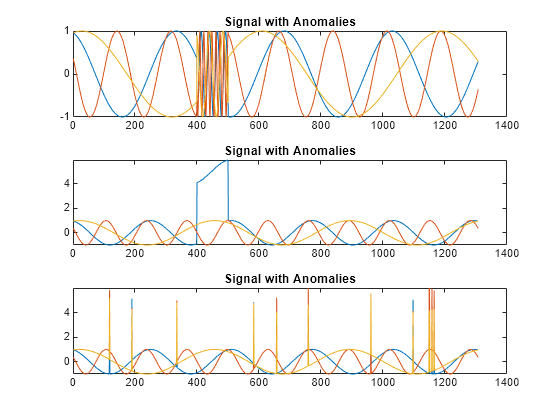
    sineWaveAbnormal contains three signals, all of the same length. Each signal in the set has one or more anomalies.

    • All channels of the first signal have an abrupt change in frequency that lasts for a finite time.

    • The second signal has a finite-duration amplitude change in one of its channels.

    • The third signal has spikes at random times in all channels.

    Plot the three signals with anomalies.

    for kj = 1:sl
        plot(ax(kj),sineWaveAbnormal{kj})
        title(ax(kj),"Signal with Anomalies")
    end

    Create an autoencoder object to detect the anomalies in the abnormal signals. The object contains a neural network that you can train to best reproduce an input set of anomaly-free data. The trained object encodes the patterns inherent in the data and can recognize if a signal contains regions that deviate from the patterns. You do not need to label any data to train the detector. The training process is unsupervised.

    By default, the deepSignalAnomalyDetector function creates objects with convolutional autoencoders. The only mandatory argument is the number of channels in the training and testing signals.

    D = deepSignalAnomalyDetector(sl)
    D = 
      deepSignalAnomalyDetectorCNN with properties:
    
                    IsTrained: 0
                  NumChannels: 3
    
       Model Information
                    ModelType: 'convautoencoder'
                   FilterSize: 8
                   NumFilters: 32
          NumDownsampleLayers: 2
             DownsampleFactor: 2
           DropoutProbability: 0.2000
    
       Threshold Information
                    Threshold: []
              ThresholdMethod: 'contaminationFraction'
           ThresholdParameter: 0.0100
    
       Window Information
                 WindowLength: 1
                OverlapLength: 'auto'
        WindowLossAggregation: 'mean'


    Use the trainDetector function to train the convolutional neural network with the normal data. Use the training options for the adaptive moment estimation (Adam) optimizer. Specify a maximum number of 100 epochs to use for training. For more information, see trainingOptions (Deep Learning Toolbox).

    opts = trainingOptions("adam",MaxEpochs=100);
    
    trainDetector(D,sineWaveNormal,opts)
        Iteration    Epoch    TimeElapsed    LearnRate    TrainingLoss
        _________    _____    ___________    _________    ____________
                1        1       00:00:04        0.001         0.49381
               50       50       00:00:16        0.001        0.065911
              100      100       00:00:26        0.001        0.047147
    Training stopped: Max epochs completed
    Computing threshold...
    Threshold computation completed.
    

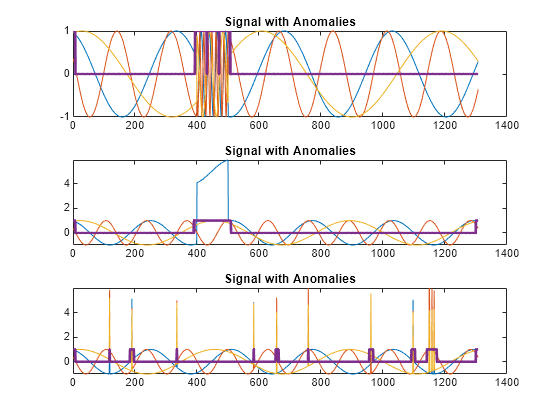
    Use the trained detector to detect the anomalies in the abnormal data. The detect function outputs two cell arrays, with each array element corresponding to a signal in the testing data.

    [lbls,loss] = detect(D,sineWaveAbnormal);

    The first output of detect is a categorical array that declares each sample of a signal as being anomalous or not. A sample can be either a point, a signal region, or an entire signal. An anomaly is detected when the reconstruction loss, or the difference between the value of a signal and the value reconstructed by the detector based on the training data, exceeds a given threshold. You can set a threshold manually or you can direct the detector to compute a threshold based on a specified statistic of loss values computed on training data.

    for kj = 1:sl
        hold(ax(kj),"on")
        plot(ax(kj),lbls{kj},LineWidth=2)
        title(ax(kj),"Signal with Anomalies")
        hold(ax(kj),"off")
    end

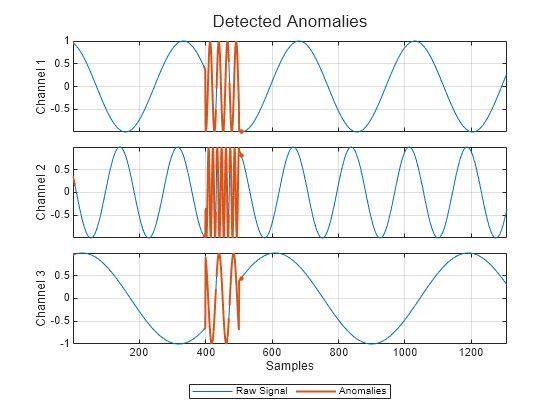
    Alternatively, use the plotAnomalies function to plot each channel of each signal and the anomalies found by the detector. The detector decides that there is an anomaly in a signal if it detects one in any of the signal channels. plotAnomalies plots the anomaly locations in all channels.

    for kj = 1:sl
        figure
        plotAnomalies(D,sineWaveAbnormal{kj})
    end

    The second output of detect is the computed reconstruction loss that the object uses to determine the labeling. You can plot the reconstruction loss directly from the output of detect, but it is more convenient to use the plotLoss function, which also displays the the threshold value above which a sample is declared to be anomalous.

    tiledlayout("vertical")
    for kj = 1:sl
        nexttile
        plotLoss(D,sineWaveAbnormal{kj})
    end

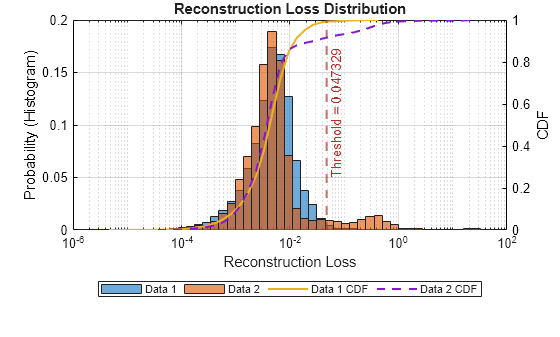
    The plotLossDistribution function displays the reconstruction loss distribution and gives insight into the way the detector chooses the threshold. You can plot the distribution loss for the normal data alongside the distribution loss for the abnormal data. The threshold chosen by the detector is larger than the loss values for most of the normal-data samples but smaller than an appreciable number of abnormal-data losses that signal the possible presence of anomalies. You can improve the choice of threshold by using the updateDetector function.

    clf
    plotLossDistribution(D,sineWaveNormal,sineWaveAbnormal)

    Use the getModel function to obtain the underlying neural network model corresponding to the detector. You can then inspect the model using analyzeNetwork (Deep Learning Toolbox).

    M = getModel(D);
    analyzeNetwork(M)

    Extended Capabilities

    Version History

    Introduced in R2023a