plotAnomalies
Description
plotAnomalies(
specifies additional options using name-value arguments.d
,s
,Name=Value
)
returns the
figure handle of the plot.f
= plotAnomalies(___)
Examples
Plot Sinusoid Anomalies Detected by Convolutional Autoencoder
Load a convolutional anomaly detector trained with three-channel sinusoidal signals. Display the model, threshold, and window properties of the detector.
load sineWaveAnomalyDetector
D
D = deepSignalAnomalyDetectorCNN with properties: IsTrained: 1 NumChannels: 3 Model Information ModelType: 'conv' FilterSize: 8 NumFilters: 32 NumDownsampleLayers: 2 DownsampleFactor: 2 DropoutProbability: 0.2000 Threshold Information Threshold: 0.0510 ThresholdMethod: 'contaminationFraction' ThresholdParameter: 0.0100 Window Information WindowLength: 1 OverlapLength: 'auto' WindowLossAggregation: 'mean'
Load the file sineWaveAnomalyData.mat
, which contains two sets of synthetic three-channel sinusoidal signals.
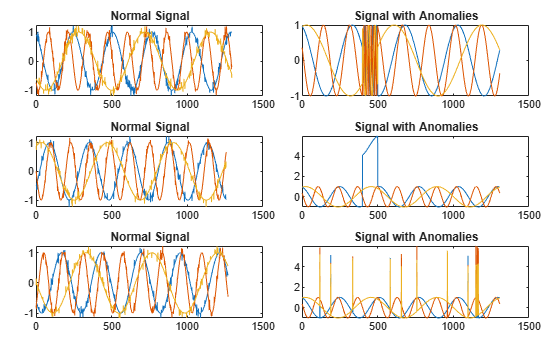
sineWaveNormal
contains the 10 sinusoids used to train the convolutional anomaly detector. Each signal has a series of small-amplitude impact-like imperfections but otherwise has stable amplitude and frequency.sineWaveAbnormal
contains three signals of similar length and amplitude to the training data. One of the signals has an abrupt, finite-time change in frequency. Another signal has a finite-duration amplitude change in one of its channels. A third has random spikes in each channel.
Plot three normal signals and the three signals with anomalies.
load sineWaveAnomalyData tiledlayout(3,2,TileSpacing="compact",Padding="compact") rnd = randperm(length(sineWaveNormal)); for kj = 1:length(sineWaveAbnormal) nexttile plot(sineWaveNormal{rnd(kj)}) title("Normal Signal") nexttile plot(sineWaveAbnormal{kj}) title("Signal with Anomalies") end
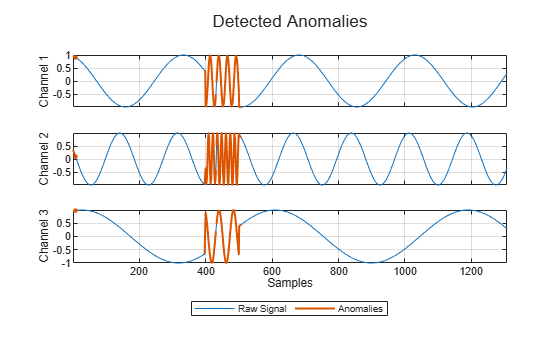
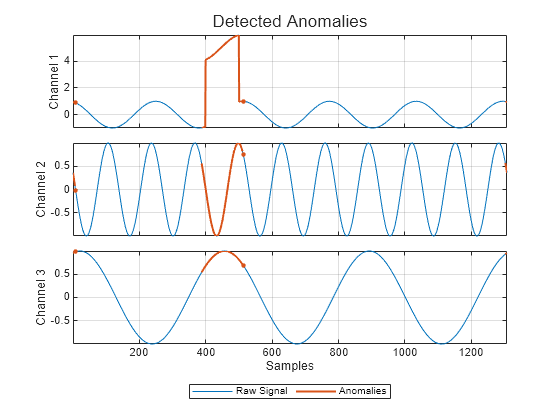
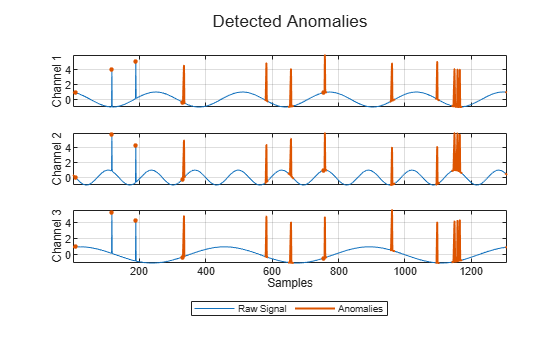
Use the trained anomaly detector to detect the anomalies in the abnormal data. Use the plotAnomalies
function to plot each channel of each signal and annotate the anomalies found by the detector. The anomalies are assigned to all channels of a signal even when they are present just in one channel.
for kj = 1:length(sineWaveAbnormal) figure plotAnomalies(D,sineWaveAbnormal{kj}) end
Input Arguments
d
— Anomaly detector
deepSignalAnomalyDetectorCNN
object | deepSignalAnomalyDetectorLSTM
object
Anomaly detector, specified as a deepSignalAnomalyDetectorCNN
or
deepSignalAnomalyDetectorLSTM
object. Use the deepSignalAnomalyDetector
function to create
d
.
s
— Signal observation
vector
Signal observation, specified as a vector.
Name-Value Arguments
Specify optional pairs of arguments as
Name1=Value1,...,NameN=ValueN
, where Name
is
the argument name and Value
is the corresponding value.
Name-value arguments must appear after other arguments, but the order of the
pairs does not matter.
Example: PlotReconstruction=true,ExecutionEnvironment="cpu"
instructs
the function to plot the reconstructed signal and use the computer CPU to detect
anomalies.
PlotReconstruction
— Option to plot reconstructed signal
false
(default) | true
Option to plot the reconstructed signal, specified as either
false
or true
.
Data Types: logical
OverlapPriority
— Label priority for overlapped windows
"anomaly"
(default) | "normal"
Label priority for overlapped windows, specified as "anomaly"
or "normal"
.
If you specify
OverlapPriority
as"anomaly"
, the function labels samples in an abnormal window overlapped with a normal window as abnormal.If you specify
OverlapPriority
as"normal"
, the function labels samples in a normal window overlapped with an abnormal window as normal.
This argument applies only the window overlap length is greater than zero.
Data Types: char
| string
ExecutionEnvironment
— Execution environment
"auto"
(default) | "gpu"
| "cpu"
Execution environment used by the network, specified as one of these:
"auto"
— If available, use the GPU. If the GPU is not available, use the CPU."gpu"
— Use the GPU."cpu"
— Use the CPU.
Data Types: char
| string
Output Arguments
f
— Figure handle
figure handle
Figure handle of the plot, returned as a figure handle.
Extended Capabilities
GPU Arrays
Accelerate code by running on a graphics processing unit (GPU) using Parallel Computing Toolbox™.
Usage notes and limitations:
The ExecutionEnvironment
option must be "gpu"
or
"auto"
when the input data is:
A
gpuArray
A cell array containing
gpuArray
objectsA datastore that outputs cell arrays containing
gpuArray
objects
For more information, see Run MATLAB Functions on a GPU (Parallel Computing Toolbox).
Version History
Introduced in R2023a
See Also
Objects
Functions
Open Example
You have a modified version of this example. Do you want to open this example with your edits?
MATLAB Command
You clicked a link that corresponds to this MATLAB command:
Run the command by entering it in the MATLAB Command Window. Web browsers do not support MATLAB commands.
Select a Web Site
Choose a web site to get translated content where available and see local events and offers. Based on your location, we recommend that you select: .
You can also select a web site from the following list:
How to Get Best Site Performance
Select the China site (in Chinese or English) for best site performance. Other MathWorks country sites are not optimized for visits from your location.
Americas
- América Latina (Español)
- Canada (English)
- United States (English)
Europe
- Belgium (English)
- Denmark (English)
- Deutschland (Deutsch)
- España (Español)
- Finland (English)
- France (Français)
- Ireland (English)
- Italia (Italiano)
- Luxembourg (English)
- Netherlands (English)
- Norway (English)
- Österreich (Deutsch)
- Portugal (English)
- Sweden (English)
- Switzerland
- United Kingdom (English)