Manage and Aggregate Coverage Results Using the Coverage Results Explorer
After you collect coverage results, you can use the Coverage Results Explorer to access, manage, and aggregate the coverage data. You can also use the Coverage Results Explorer to create coverage reports.
Access Coverage Data
To open the Coverage Results Explorer, in the Coverage Analyzer app, click Results Explorer. The Coverage Results Explorer opens to show the most recent coverage run.
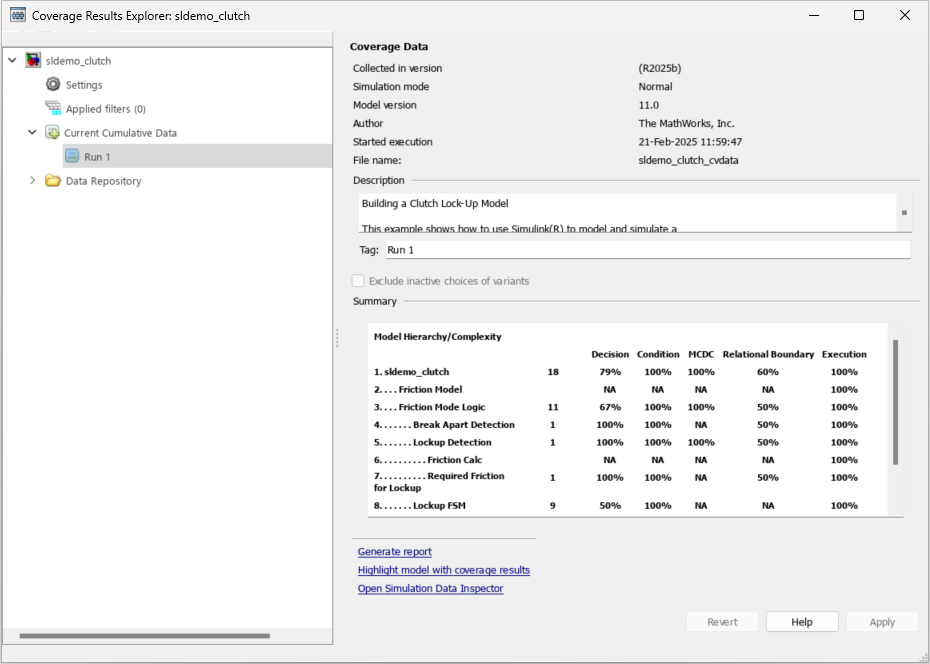
Each run includes a summary of the coverage data, the description of the model, a tag, and information such as the MATLAB version used to create the coverage data, the model version, and other information about the model. You can view other runs in the left pane, under Current Cumulative Data. For each run, or for the current cumulative data, you can also:
Click Generate Report to create a full coverage report.
Click Highlight model with coverage results to highlight the model with the coverage results. When you highlight the model with coverage results, the Coverage Results Explorer displays (H) next to the currently highlighted run name in the left pane.
Click Open Simulation Data Inspector to view the simulation data from the current selected run in the Simulation Data Inspector. To enable this option, the model must contain data that the Simulation Data Inspector can open, such as logged signal data.
Manage Coverage Data
For each run, you can modify the Description and Tag fields. Before you leave the coverage data details view, click Apply to apply your changes. If you leaving the coverage data details without applying your changes, the changes revert.
When you change the descriptions or tags, an asterisk appears next to the run name in the left pane. To save these changes, right-click the run name in the left pane and click Save modified coverage data.
Aggregate Coverage Data
If you interactively analyze coverage multiple times in one session, Simulink® Coverage™ aggregates the coverage data and displays it under in the left pane under the Current Cumulative Data and Data Repository sections. Under Data Repository, you can right-click and select Include in cumulative data or Exclude from cumulative data to add or remove coverage data to the current cumulative data, respectively.
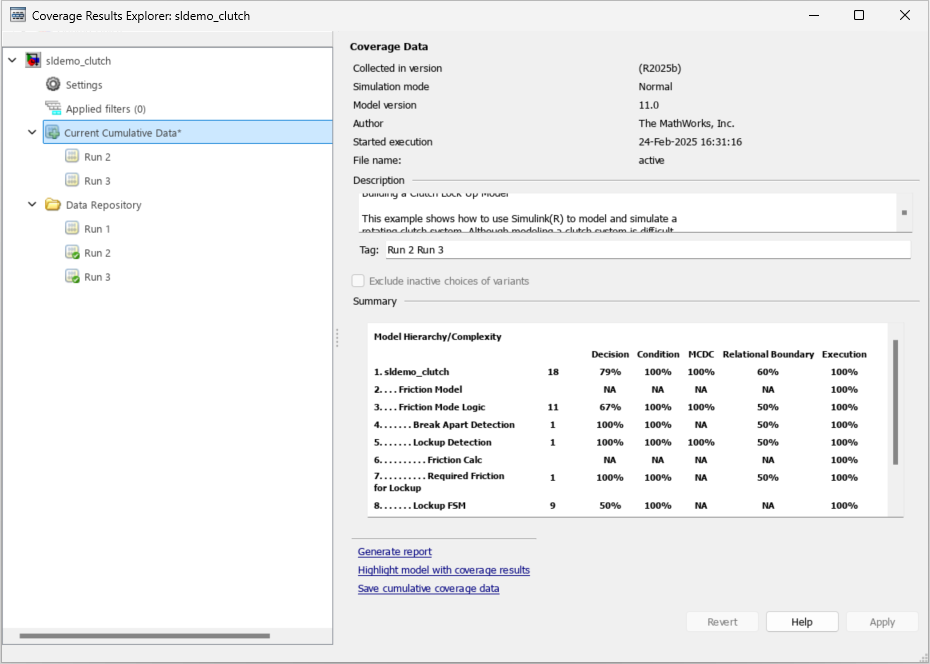
To save the current cumulative data set to a CVT file, in the left pane, click Current Cumulative Data, then click Save cumulative coverage data. Alternatively, you can right-click Current Cumulative Data and select Save cumulative coverage data.
Load Existing Coverage Data
The input folder is where Simulink Coverage saves coverage results. You specify the input folder by setting the Output directory model configuration parameter.
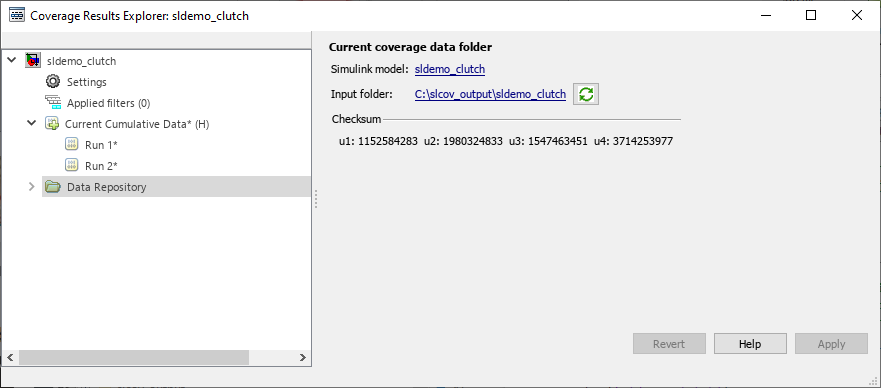
To synchronize the data in the input folder and the data in the data
repository, click Synchronize with the current coverage data folder
![]() .
.
To load existing coverage data to the data repository:
Right-click the Data Repository.
Select Load coverage data.
Select existing coverage data for the current model and click Open.
See Also
cvdata | cvhtml | Coverage
Results Explorer | Exclude
inactive choices of variants