Main Content

maineffectsplot

Main effects plot for grouped data

Syntax

maineffectsplot(Y,GROUP)
maineffectsplot(Y,GROUP,param1,val1,param2,val2,...)
[figh,AXESH] = maineffectsplot(...)

Description

maineffectsplot(Y,GROUP) displays main effects plots for the group means of matrix Y with groups defined by entries in GROUP, which can be a cell array or a matrix. Y is a numeric matrix or vector. If Y is a matrix, the rows represent different observations and the columns represent replications of each observation. If GROUP is a cell array, then each cell of GROUP must contain a grouping variable that is a categorical variable, numeric vector, character matrix, string array, or single-column cell array of character vectors. If GROUP is a matrix, then its columns represent different grouping variables. Each grouping variable must have the same number of rows as Y. The number of grouping variables must be greater than 1.

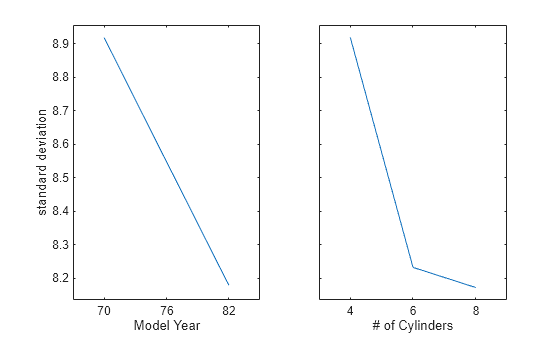
The display has one subplot per grouping variable, with each subplot showing the group means of Y as a function of one grouping variable.

maineffectsplot(Y,GROUP,param1,val1,param2,val2,...) specifies one or more of the following name/value pairs:

  • 'varnames' — Grouping variable names in a character matrix, a string array, or a cell array of character vectors, one per grouping variable. Default names are 'X1', 'X2', ... .

  • 'statistic' — Values that indicate whether the group mean or the group standard deviation should be plotted. Use 'mean' or 'std'. The default is 'mean'. If the value is 'std', Y is required to have multiple columns.

  • 'parent' — A handle to the figure window for the plots. The default is the current figure window.

[figh,AXESH] = maineffectsplot(...) returns the handle figh to the figure window and an array of handles AXESH to the subplot axes.

Examples

collapse all

Load the sample data.

load carsmall;

Display main effects plots for car weight with two grouping variables, model year and number of cylinders.

maineffectsplot(Weight,{Model_Year,Cylinders}, ...
               'varnames',{'Model Year','# of Cylinders'})

Figure contains 2 axes objects. Axes object 1 with xlabel Model Year, ylabel mean contains an object of type line. Axes object 2 with xlabel # of Cylinders contains an object of type line.

Version History

Introduced in R2006b