Code Execution Profiling on PX4 Targets
Sample times you specify in a Simulink® model determine the time schedule for running generated code on target hardware. With enough computing power on the hardware, the code runs in real-time according to the specified sample times. With real-time execution profiling, you can check if the generated code meets your real-time performance requirements.
You can use code execution profiling results to enhance the design of your system. For example, if the code easily meets the real-time requirements, you can consider adding more functionality to your system to exploit available processing power. If the code does not meet real-time requirements, you can look for ways to reduce execution time. For example, you can identify the tasks that require the most time and then investigate whether trade-off between functionality and speed is possible.
This example introduces a workflow for real-time code execution profiling by showing you how to:
Configure the model for code execution profiling, and generate code.
Run generated code on target hardware.
Analyze performance through code execution profiling plots and reports.
Profiling with XCP External Mode
Real time profiling data can be obtained by using the XCP External Mode infrastructure. To configure a Simulink model for real-time profiling perform these steps:
In the Simulink Editor, select Modeling > Model Configuration. In the Configuration Parameter dialog box, click External mode.

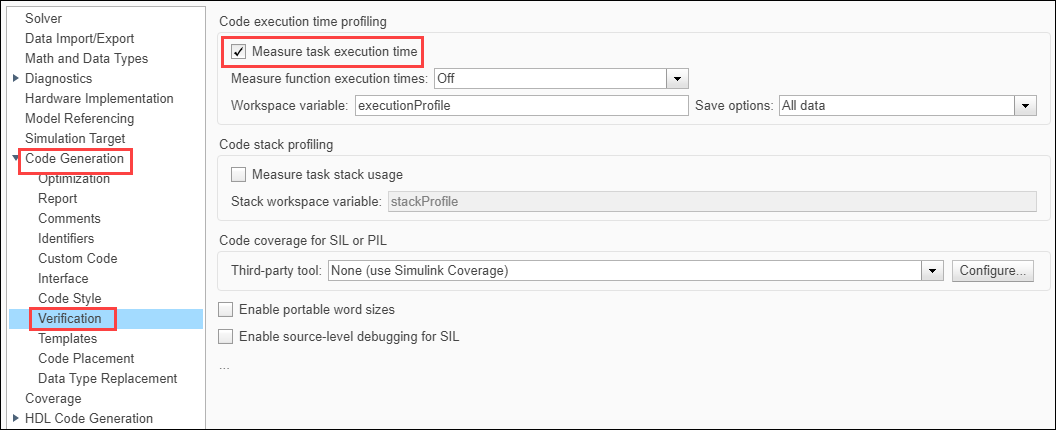
Navigate to Code generation > Verification and select Measure task execution time.

Select the required option for Measure function execution time.

Off– Select this option to disable Profiling. Only Task profiling is available in this option.Coarse (referenced models and subsystems only)– Select this option to analyse generated function code for the main model components.Detailed (all function call sites)– Select this option to analyse generated function code for all blocks in the model
Enter the required value for Workspace variable. It is the variable in the MATLAB® workspace used for storing data received from the target.
Select the required option for Save options. For help on selecting the save options, see Save Options.

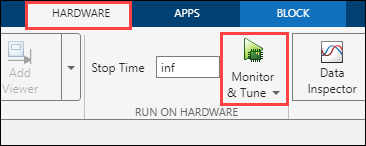
Click Monitor & Tune from the Hardware tab of Simulink toolstrip to generate the profiling report.

After the simulation ends, a profiling report is generated with profiling metrics of different tasks/functions that are being profiled. For more information, see Code Execution Profiling on PX4 Target in Monitor & Tune Simulation.
For information on code execution profiling with SIL and PIL, see Create Execution-Time Profile for Generated Code (Embedded Coder).
Save Options
Save options are used to select the required type of report. The following table explains the differences between save options.
| Summary data only | All data | Metrics only | |
|---|---|---|---|
| Real-time data | Available | Available | Not available. Target sends profiling data only at the end of the simulation. |
| Host memory requirement | This option requires less memory as the host stores only summary metrics of Profiling Data. For example, 11 KB data for a model running for 50 seconds. | This option requires large memory as the host stores all the data sent by the target .For example, 1500 KB data for a model running for 50 seconds. | This option requires less memory as the host stores only the metrics data sent by the target. For example, 12 KB of data for a model running for 50 seconds. |
| SDI streaming | Available | Available | Not available |
| Bandwidth requirement | Requires additional bandwidth. | Requires additional bandwidth. | Does not require additional bandwidth. |
Selecting save options. This section helps you to select the recommended save options in different scenarios.
All data– Select this option, if the host has enough memory and the target has the required bandwidth to stream data.Summary data Only– Select this option, if the simulation is running for a long time and host does not have a lot of memory.Metrics Only– Select this option, if the target does not have enough time/bandwidth to stream profiling data.
Troubleshooting
Data Drop in Signal Logging or Code Execution Profiling
Description
Data drops can occur either in signal logging or profiling.
Action
Both Signal Logging and Profiling data streaming use the same communication channel to send data from the target. As channel bandwidth is limited, there could be data drops at high sample rates. This issue can be mitigated by streaming only the data you need. If only the profiling data is required, disable signal logging by clearing all the check boxes in Configuration Parameters > Data Import/Export > Save to workspace or file.