Main Content

plot

Description

plot(points) plots points in the current axis.

example

plot(points,ax) plots points in the specified axis.

Examples

collapse all

Read an image.

I = imread("cameraman.tif");

Detect corner features.

featurePoints = detectHarrisFeatures(I);

Plot feature image with detected features.

imshow(I);
hold on;
plot(featurePoints);
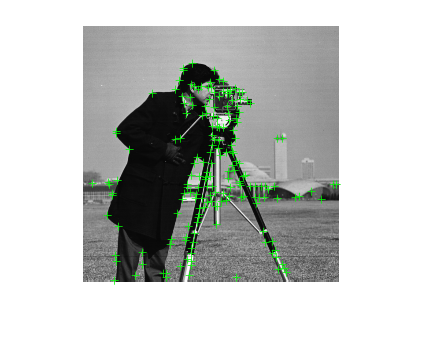
Figure contains an axes object. The hidden axes object contains 2 objects of type image, line. One or more of the lines displays its values using only markers

Input Arguments

collapse all

Points object,specified as an M-by-2 matrix of M number of [x y] coordinates, or as one of the point feature objects described in Point Feature Types. The object contains information about the feature points detected in the input image. To obtain points, use the appropriate detect function that pairs with the point feature type.

Handle to use for display. You can set the handle using gca.

Version History

Introduced in R2011b

See Also

Functions

Go to top of page