estimateAnchorBoxes
Estimate anchor boxes for deep learning object detectors
Syntax
Description
anchorBoxes = estimateAnchorBoxes(trainingData,numAnchors)
[
additionally returns the mean intersection-over-union (IoU) value of the anchor boxes in
each cluster.anchorBoxes,meanIoU] = estimateAnchorBoxes(trainingData,numAnchors)
Examples
This example shows how to estimate anchor boxes using a table containing the training data. The first column contains the training images and the remaining columns contain the labeled bounding boxes.
data = load("vehicleTrainingData.mat");
trainingData = data.vehicleTrainingData;
Create a boxLabelDatastore object using the labeled bounding boxes from the training data.
blds = boxLabelDatastore(trainingData(:,2:end));
Specify the class names using the labels from the training data.
classes = trainingData.Properties.VariableNames(2:end);
Estimate the anchor boxes using the boxLabelDatastore object.
numAnchors = 5;
anchorBoxes = estimateAnchorBoxes(blds,numAnchors);
Specify the image size.
inputImageSize = [128 228 3];
Use a pretrained ResNet-50 network as a base network for the YOLO v2 network.
baseNet = imagePretrainedNetwork("resnet50");Specify the network layer to use for feature extraction. You can use the analyzeNetwork function to see all the layer names in a network.
featureLayer = "activation_49_relu";Create the YOLO v2 object detection network.
detector = yolov2ObjectDetector(baseNet,classes,anchorBoxes, ...
    DetectionNetworkSource=featureLayer)
detector =
yolov2ObjectDetector with properties:
Network: [1×1 dlnetwork]
InputSize: [224 224 3]
TrainingImageSize: [224 224]
AnchorBoxes: [5×2 double]
ClassNames: vehicle
ReorganizeLayerSource: ''
LossFactors: [5 1 1 1]
ModelName: ''
Visualize the network using the network analyzer.
analyzeNetwork(detector.Network)
Anchor boxes are important parameters of deep learning object detectors such as Faster R-CNN and YOLO v2. The shape, scale, and number of anchor boxes impact the efficiency and accuracy of the detectors.
For more information, see Anchor Boxes for Object Detection.
Load Training Data
Load the vehicle dataset, which contains 295 images and associated box labels.
data = load('vehicleTrainingData.mat');
vehicleDataset = data.vehicleTrainingData;
Add the full path to the local vehicle data folder.
dataDir = fullfile(toolboxdir('vision'),'visiondata');
vehicleDataset.imageFilename = fullfile(dataDir,vehicleDataset.imageFilename);
Display the data set summary.
summary(vehicleDataset)
Variables:

    imageFilename: 295×1 cell array of character vectors

    vehicle: 295×1 cell
Visualize Ground Truth Box Distribution
Visualize the labeled boxes to better understand the range of object sizes present in the data set.
Combine all the ground truth boxes into one array.
allBoxes = vertcat(vehicleDataset.vehicle{:});Plot the box area versus the box aspect ratio.
aspectRatio = allBoxes(:,3) ./ allBoxes(:,4);
area = prod(allBoxes(:,3:4),2);

figure
scatter(area,aspectRatio)
xlabel("Box Area")
ylabel("Aspect Ratio (width/height)");
title("Box Area vs. Aspect Ratio")
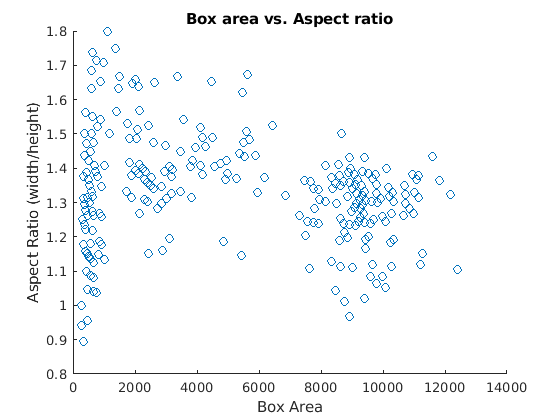
The plot shows a few groups of objects that are of similar size and shape, However, because the groups are spread out, manually choosing anchor boxes is difficult. A better way to estimate anchor boxes is to use a clustering algorithm that can group similar boxes together using a meaningful metric.
Estimate Anchor Boxes
Estimate anchor boxes from training data using the estimateAnchorBoxes function, which uses the intersection-over-union (IoU) distance metric.
A distance metric based on IoU is invariant to the size of boxes, unlike the Euclidean distance metric, which produces larger errors as the box sizes increase [1]. In addition, using an IoU distance metric leads to boxes of similar aspect ratios and sizes being clustered together, which results in anchor box estimates that fit the data.
Create a boxLabelDatastore using the ground truth boxes in the vehicle data set. If the preprocessing step for training an object detector involves resizing of the images, use transform and bboxresize to resize the bounding boxes in the boxLabelDatastore before estimating the anchor boxes.
trainingData = boxLabelDatastore(vehicleDataset(:,2:end));
Select the number of anchors and estimate the anchor boxes using estimateAnchorBoxes function.
numAnchors = 5;
[anchorBoxes,meanIoU] = estimateAnchorBoxes(trainingData,numAnchors);
anchorBoxes
5;
[anchorBoxes,meanIoU] = estimateAnchorBoxes(trainingData,numAnchors);
anchorBoxesanchorBoxes = 5×2
21 27
Choosing the number of anchors is another training hyperparameter that requires careful selection using empirical analysis. One quality measure for judging the estimated anchor boxes is the mean IoU of the boxes in each cluster. The estimateAnchorBoxes function uses a k-means clustering algorithm with the IoU distance metric to calculate the overlap using the equation, 1 - bboxOverlapRatio(allBoxes,boxInCluster).
meanIoU
meanIoU =
0.8411
The mean IoU value greater than 0.5 ensures that the anchor boxes overlap well with the boxes in the training data. Increasing the number of anchors can improve the mean IoU measure. However, using more anchor boxes in an object detector can also increase the computation cost and lead to overfitting, which results in poor detector performance.
Sweep over a range of values and plot the mean IoU versus number of anchor boxes to measure the tradeoff between number of anchors and mean IoU.
maxNumAnchors = 15;
meanIoU = zeros([maxNumAnchors,1]);
anchorBoxes = cell(maxNumAnchors, 1);
for k = 1:maxNumAnchors
    % Estimate anchors and mean IoU.
    [anchorBoxes{k},meanIoU(k)] = estimateAnchorBoxes(trainingData,k);
end

figure
plot(1:maxNumAnchors,meanIoU,'-o')
ylabel("Mean IoU")
xlabel("Number of Anchors")
title("Number of Anchors vs. Mean IoU")
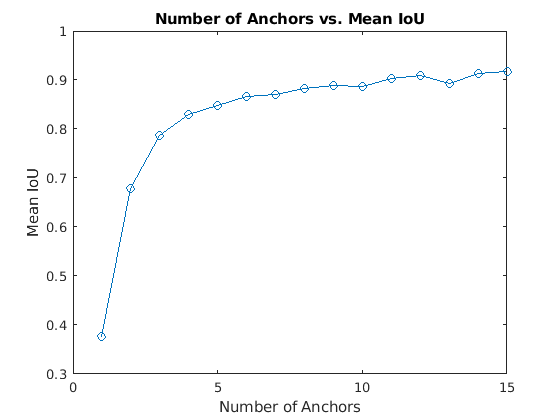
Using two anchor boxes results in a mean IoU value greater than 0.65, and using more than 7 anchor boxes yields only marginal improvement in mean IoU value. Given these results, the next step is to train and evaluate multiple object detectors using values between 2 and 6. This empirical analysis helps determine the number of anchor boxes required to satisfy application performance requirements, such as detection speed, or accuracy.
Input Arguments
Labeled ground truth images, specified as a datastore or a table.
If you use a datastore, your data must be set up so that calling the datastore with the
readandreadallfunctions returns a cell array or table with two or three columns.When the output contains two columns, the first column must contain bounding boxes, and the second column must contain labels, {boxes,labels}.
When the output contains three columns, the second column must contain the bounding boxes, and the third column must contain the labels, {data,boxes,labels}. In this case, the first column can contain any type of data. For example, the first column can contain images or point cloud data. The last column, labels, must be a cell array that contains M-by-1 categorical vectors containing object class names. All categorical data returned by the datastore must contain the same categories.
If you use a table, the table must have two or more columns. The first column of the table must contain image file names with paths. The images must be grayscale or truecolor (RGB) and they can be in any format supported by
imread. Each of the remaining columns must be a cell vector that specifies a single object class such as vehicle, flower, or stop sign in the form of an axis-aligned or a rotated rectangle bounding box. The columns must be only axis-aligned or rotated rectangle bounding boxes. For example, column 4 cannot specify axis-aligned boxes if column 3 specifies rotated rectangles. All the columns must be of the same bounding box type.Note
When the training data is specified using a table, the
estimateAnchorBoxesfunction checks these conditionsAxis-aligned bounding box values must be integers. Otherwise, the function automatically rounds each noninteger values to its nearest integer.
The bounding box must not be empty and must be within the image region. While training the network, the function ignores empty bounding boxes and bounding boxes that lie partially or fully outside the image region.
When bounding boxes are rotated rectangles, the
estimateAnchorBoxesfunction uses only the location, width, and height values of the bounding box to form similar axis-aligned anchor boxes.
The table describes the format of bounding boxes.
| Bounding Box | Description |
|---|---|
Axis-aligned rectangle |
Defined in spatial coordinates as an M-by-4 numeric matrix with rows of the form [x y w h], where:
|
Rotated rectangle |
Defined in spatial coordinates as an M-by-5 numeric matrix with rows of the form [xctr yctr w h yaw], where:
|

For more information, see Datastores for Deep Learning (Deep Learning Toolbox).
Number of anchor boxes for the function to return, specified as an integer.