Tumor grading in GUI or ...?
Show older comments
I have micro tumor images(9) and there are areas of dlbcl tumor (Nd DAB-stained and Nh H-stained) Proliferation index for this is a solution of the equation PIc=Nd/(Nh+Nd). I have to find PIc for all pictures knowing RGB intervals for Nh= (<45, 180>, <50, 185>, <160, 215>) and for Nd= (<40, 115>, <6,80>, <10,75>). How AM i supposed to do it? Please help!!
4 Comments
The question contains a lot of details, which do not matter the problem. As far as I understand you have RGB images and want to find regions in RGB intervals? Then what about:
img = rand(64, 480, 3); % Test data
match = (img(:, :, 1) > 45 & img(:, :, 1) < 180) & ...
(img(:, :, 2) > 50 & img(:, :, 2) < 185) & ...
(img(:, :, 3) > 160 & img(:, :, 3) < 215);
Looks straight.
But now "PIc=Nd/(Nh+Nd)" is not clear. What do you have to calculate exactly? How is Nh and Nd defined? Remember that your notation "Nh= (<45, 180>, <50, 185>, <160, 215>)" is not explained anywhere but a new invention. My above idea is a pure guess only.
Aneta Chwala
on 22 Nov 2018
Image Analyst
on 22 Nov 2018
And the equations in my answer below don't do it? Please explain why not. And attach your image.
Aneta Chwala
on 22 Nov 2018
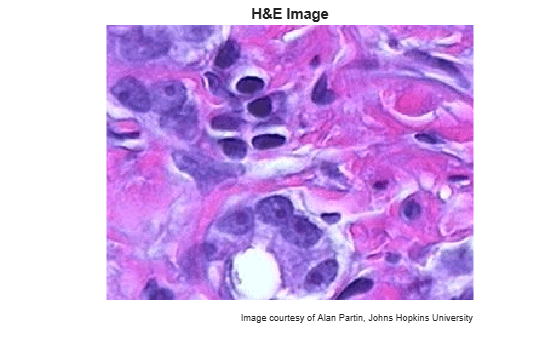
Image Analyst I am sorry I am new to MATLAB and I don't really know. But since the Jan's comment isn't ok (?) then how to modify it to your code and what it actually means? It's confusing for me. I didn't get images but they look similar to this:

Answers (4)
Image Analyst
on 22 Nov 2018
Use the code in Jan's comment above, but modify it to get two binary images: matchNh and matchNd. Then I think you want the sum (count) and ratio
Nd = nnz(matchNd)
Nh = nnz(matchNh)
Plc = Nd / (Nh + Nd)
Image Analyst
on 22 Nov 2018
1 vote
4 Comments
Aneta Chwala
on 22 Nov 2018
Image Analyst
on 22 Nov 2018
Edited: Image Analyst
on 22 Nov 2018
Why can't you use clustering??? That's strange.
Have you tried the Color Thresholder on the Apps tab?
As you can see from the RGB gamut below, it will be virtually impossible in rgb color space.

You'd be better off in HSV color space.

Aneta Chwala
on 22 Nov 2018
Image Analyst
on 23 Nov 2018
Look at the gamuts - they're essentially a 3-D histogram where there is one point for every (r,g,b) triplet (every pixel value/color).
Point 1: note how there are no well contained clusters - it's basically a continuum - so the dividing plane will essentially be sort of arbitrary. You could almost put it wherever you want but at least kmeans has some sort of logic behind where it splits the gamut into the 2 colors.
Point 2: thresholding essentially divides up the gamut by slicing the color could with planes aligned with the axes, and you can see that there are no planes perpendicular to the R, G, and B axes that will do even a half way decent job of dividing the image up into different colors that are meaningfull. With HSV color space, your dividing surfaces are basically cones, sectors, and planes perpendicular to the V axis. By doing that, you can definitely carve out different regions because the hue, saturation, and brightness are different between the pink, purple, and white. The R, G, and B are also different, but you can see that planes perpendicular to the axes will not carve that cloud up into pink, purple, and white sub-clouds.
Aneta Chwala
on 27 Nov 2018
0 votes
3 Comments
Image Analyst
on 27 Nov 2018
You forgot to attach the image.
Why do you say it's wrong?
Aneta Chwala
on 27 Nov 2018
Image Analyst
on 27 Nov 2018
Yes, you may.
If it's unrelated to your first one way at the top, then create a new thread.
Aneta Chwala
on 27 Nov 2018
0 votes
Categories
Find more on Red in Help Center and File Exchange
on 22 Nov 2018
on 27 Nov 2018
Community Treasure Hunt
Find the treasures in MATLAB Central and discover how the community can help you!
Start Hunting!