Why does imshow() behave differently depending on timing?
Show older comments
I have this code, where I create 2 UIFigures, and use imshow to display an image in them. But, depending on whether I wait a bit before calling imshow, the figure properties are different.
im = imread('peppers.png');
uif1 = uifigure;
uiax1 = axes(uif1);
pause(5) % This is the only difference
imshow(im, 'Parent', uiax1)
uif2 = uifigure;
uiax2 = axes(uif2);
imshow(im, 'Parent', uiax2)
I wrote this snippet to compare the properties:
% Get properties for both axes
props1 = get(uiax1);
props2 = get(uiax2);
% Compare the value of each property between both axes
for f = fieldnames(props1)'
% Discriminate between char and numeric properties
if isnumeric(props1.(f{1}))
comp = ( props1.(f{1}) == props2.(f{1}) );
elseif ischar(props1.(f{1})) || isstring(props1.(f{1}))
comp = strcmp(props1.(f{1}), props2.(f{1}));
end
% If they are not the same, write the values in the console
if ~all(comp)
fprintf('Variable: %s \n', f{1})
if ischar(props1.(f{1}))
fprintf('Value in ax1: %s \nValue in ax2: %s \n' ,props1.(f{1}), props2.(f{1}))
else
fprintf('Value in ax1: %s \nValue in ax2: %s \n' ,mat2str(props1.(f{1})), mat2str(props2.(f{1})))
end
fprintf('\n')
end
end
This is the output. The CameraViewAngle is different, as well as the position properties.
% Variable: CameraViewAngle
% Value in ax1: 6.86722727382441
% Value in ax2: 9.14779804245545
%
% Variable: Position
% Value in ax1: [0.13 0.11 0.775 0.815]
% Value in ax2: [0.125510200992791 0.134870716465011 0.746355685131195 0.805031446540881]
%
% Variable: OuterPosition
% Value in ax1: [0 0 1 1]
% Value in ax2: [0.000315053809494203 0.0262161653981438 0.963039593717671 0.98776864606243]
%
% Variable: ActivePositionProperty
% Value in ax1: outerposition
% Value in ax2: position
%
% Variable: TightInset
% Value in ax1: [0.0391448012890748 0.0555975153927699 0 0]
% Value in ax2: [0.048765791400876 0.0554577329623624 0 0]
The plots look almost the same but you can tell they are not identical:
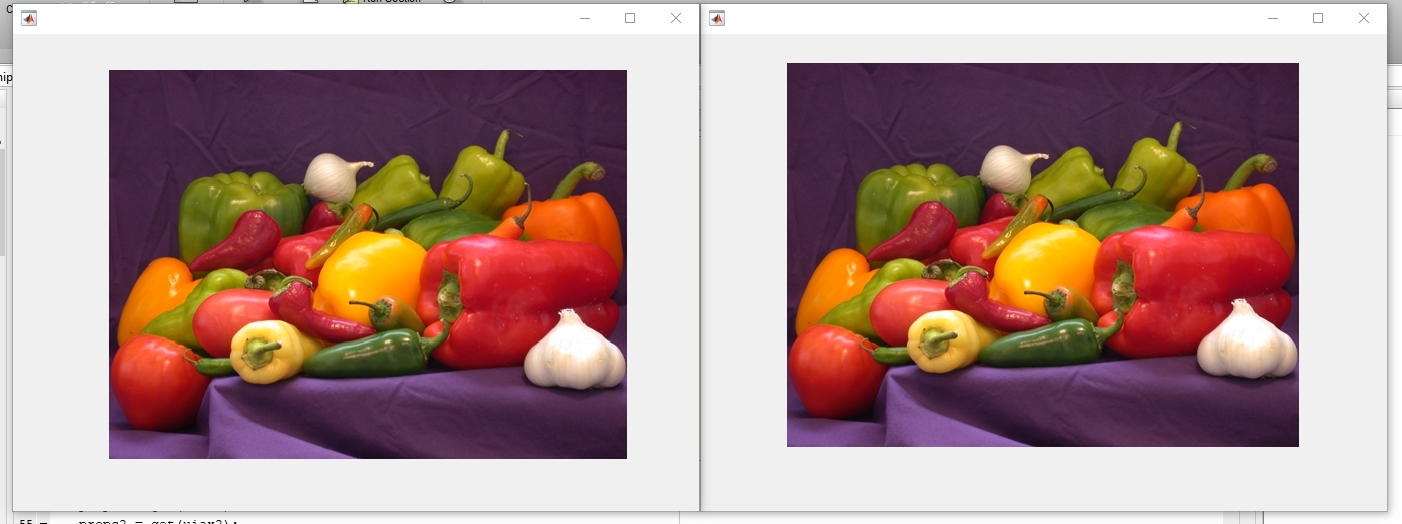
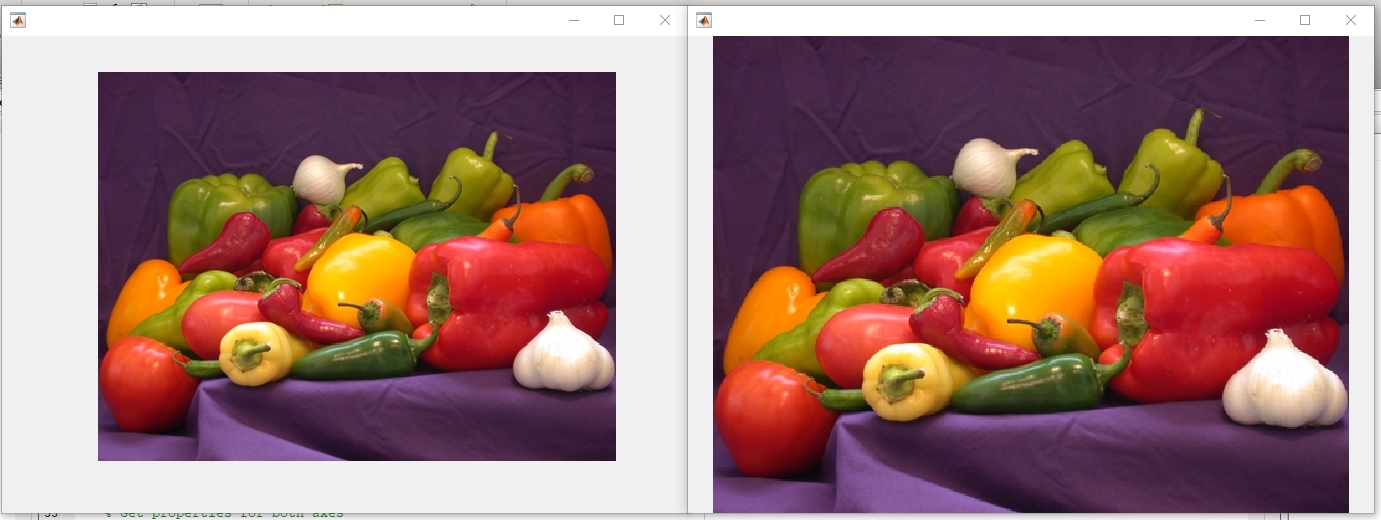
Now the interesting part, if I change the Position property right after calling imshow, now the paused image does not get the Position set correctly. In fact, nothing changes for it. The other one gets it right and fills the figure.
im = imread('peppers.png');
uif1 = uifigure;
uiax1 = axes(uif1);
pause(5)
imshow(im, 'Parent', uiax1)
uiax1.Position = [0 0 1 1];
uif2 = uifigure;
uiax2 = axes(uif2);
imshow(im, 'Parent', uiax2)
uiax2.Position = [0 0 1 1];
%% Properties
% Variable: Position
% Value in ax1: [0.13 0.11 0.775 0.815]
% Value in ax2: [0 0 1 1]
%
% Variable: OuterPosition
% Value in ax1: [0 0 1 1]
% Value in ax2: [-0.167741935483871 -0.134969325153374 1.29032258064516 1.22699386503067]
%
% Variable: ActivePositionProperty
% Value in ax1: outerposition
% Value in ax2: position
%
% Variable: TightInset
% Value in ax1: [0.0391448012890748 0.0555975153927699 0 0]
% Value in ax2: [0.0141302230428502 0.0580573341881453 0 0]
I discovered that actually, right after using imshow both axes get ActivePositionProperty set to 'position', but the axes that was paused reverts to 'outerposition' shortly after. This code shows it.
im = imread('peppers.png');
uif1 = uifigure;
uiax1 = axes(uif1);
uiax1.ActivePositionProperty
pause(5)
uiax1.ActivePositionProperty
imshow(im, 'Parent', uiax1)
uiax1.ActivePositionProperty
pause(5)
uiax1.ActivePositionProperty
Maybe that is the reason setting the Position right after imshow does not seem to work (because it gets reset afterwards anyway).
I am sure there are a bunch of unpredicted behaviors derived out of this. And I suspect some problems I have faced while designing a GUI have this kind of weird axes layout behavior at the root.
Can someone reproduce this and propose an explanation/fix?
2 Comments
Guillaume
on 28 May 2019
Which version of matlab (please fill in the required field on the right of the page below the tags) and which OS?
On my machine, R2019a (version 9.6.0.1072779), Windows, you script doesn't find any difference between the two figures.
Antonio Martínez Brotons
on 28 May 2019
Edited: Antonio Martínez Brotons
on 28 May 2019
Answers (0)
Categories
Find more on Environment and Settings in Help Center and File Exchange
on 28 May 2019
on 28 May 2019
Community Treasure Hunt
Find the treasures in MATLAB Central and discover how the community can help you!
Start Hunting!