Multiple axis in simulink scope
74 views (last 30 days)
Show older comments
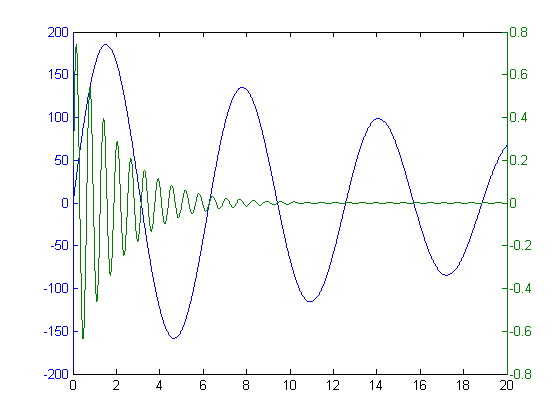
Is it possible to have two graphs with different scales in the same scope (i.e. not a separated layout, like in this question ) ?
In plain matlab it is possible to do something like the following:

I would like to do the same within a simulink scope
0 Comments
Accepted Answer
Aghamarsh Varanasi
on 20 Mar 2020
Hi ,
Currently the plots in the Scope are limited by only one y-axis. You could show two different signals with different units and rescale the plot to show both signals together, showing separate axes is a workflow currently not supported.
However, I have brought this issue to the concerned people and it might be considered in a future release.
4 Comments
Byri Manoj
on 10 Apr 2023
Is there any progress on this issue? Is it been added in 2023 release??
More Answers (2)
Alluru Hari Hara Sai Rama krishna
on 14 Jun 2021
Edited: Alluru Hari Hara Sai Rama krishna
on 14 Jun 2021
How can I display 2 graphs in one axis
See Also
Community Treasure Hunt
Find the treasures in MATLAB Central and discover how the community can help you!
Start Hunting!