Results for
Hello everyone !!!!
I try to develop a test bench for cybersecurity in micro grids (Generations, Breakers,...) . I plan to simulate my grid on Simpower. I have a simulated PLC in a VM and a real RTAC. I would like to establish bidirectional communication between my grid simulated on Simpower and the physical RTAC (or the simulated PLC on VM). The RTAC is connected to a SCADA system which should be able to send commands to the grid (Simpower).
RTAC, Simpower, and the SCADA system are located on separate machines.
Any approach to establish a connection between Simpower and the RTAC (or PLC)?
Thanks !!!
Dear contest participants,
Happy Friday! I am thrilled to share some exciting news with you. Cleve Moler, the father of MATLAB, has just published a captivating blog post dedicated to our outstanding Flipbook Mini Hack contest!
In his blog post, Cleve expresses his genuine admiration for the multitude of creative styles, artistic talents, and ingenious programming techniques that have been showcased throughout the contest. What's even more remarkable is that he handpicked some of his personal favorites! You don't want to miss this opportunity to see what Cleve has to say.
But that's not all! Your exceptional animations have sparked immense interest among the MathWorks teams. This means you have a direct impact on the next generation of animation tools in MATLAB! We value your thoughts and ideas, so please don't hesitate to share them with us.
Let's keep up the phenomenal work in the remaining two weeks, and together, we'll continue to push the boundaries of creativity and innovation.
Wishing you all an incredible weekend ahead!
Enthusiastically yours,
Chen
I think it would be a really great feature to be able to add an Alpha property to the basic "Line" class in MATLAB plots. I know that I have previously had to resort to using Patch to be able to plot semitransparent lines, but there are also so many other functions that rely on the "Line" class.
For example, if you want to make a scatter plot from a table with things specified into groups, you can use ScatterHistogram or gscatter but since gscatter uses the Line class, you can't adjust the marker transparency. So if you don't want the histograms, you are stuck with manually separating it and using scatter with hold on.
Hello! I'm currently working on a heat transfer problem, I don't consider myself to be an expert, therefore I'm still learning how to use this tool.
Here's the thing: I have pretty much everything working, but there's an issue. The ELSE equation is not giving any results and I don't know exactly why. I would appreciate if someone would be interested in helping me learn about this because I'm at a loss righ now
%% Parámetros geométricos del dominio
A=3; %Anchura (en metros)
H=2.5; %Altura (en metros)
Nx= 7; %Número de nodos en la dirección x
Ny=6; %Número de nodos en la dirección y
dx=A/(Nx-1); %Distancia de elemento finito en dirección x (metros)
dy=H/(Ny-1); %Distancia de elemento finito en direccion y (metros)
%% Condiciones iniciales y de frontera
To=1000; %Temperatura interna del horno (en C)
T = ones(Nx,Ny);
Tinf=20; %Temperatura externa (en C)
ho=100; %Coeficiente de transferencia convectiva interior (en W/m^2K)
hinf=10; %Coeficiente de transferencia convectiva exterior (en W/m^2K)
q_dot=8000; %Calor generado por unidad volumétrica
K=1; %Conductividad del material (en W/mK)
epsilon=1e-5;
Error=5;
%% Computación
iter=0;
while (Error>epsilon)
iter=iter+1;
disp(iter);
Told=T;
for j=1:Ny
for i=1:Nx
if i==Nx
for j=2:Ny-1
T(i,j)=(2*T(i-1,j)+T(i,j-1)+T(i,j+1)+(q_dot*dx^2)/K)/4;
end
for j=Ny
T(i,j)=T(i,j-1)+T(i-1,j)+(q_dot*dx^2)/(2*K)+(hinf*dx*Tinf)/K;
end
for j=1
T(i,j)=((q_dot*dx^2)/(2*K)+T(i-1,j)+T(i,j+1));
end
elseif i==1
for j=Ny*4/6:Ny-1
T(i,j)=(2*T(i+1,j)+T(i,j-1)+T(i,j+1)+(q_dot*dx^2)/K)/4;
end
for j=Ny*0.5
T(i,j)=T(i,j+1)+T(i+1,j)+(q_dot*dx^2)/(2*K)+(hinf*dx*Tinf)/K;
end
for j=Ny
T(i,j)=T(i,j-1)+T(i+1,j)+(q_dot*dx^2)/(2*K)+(ho*dx*To)/K;
end
elseif i>1 && i<Nx
for j=Ny
T(i,j)=(T(i-1,j)+T(i+1,j)+2*T(i,j-1)+(q_dot*dx^2)/K+(2*hinf*dx*Tinf)/K)/(4+2*hinf*dx/K);
end
elseif 2<i && i<Nx*3/7
for j=Ny*0.5
T(i,j)=((T(i-1,j)+T(i+1,j)+2*T(i,j+1)+(q_dot*dx^2)/K)+(2*ho*dx*To)/K)/(4+2*hinf*dx/K);
end
elseif i==Nx*4/7
for j=2:Ny*2/6
T(i,j)=((T(i,j-1)+T(i-j+1)+2*T(i+1,j)+(q_dot*dx^2)/K)+(2*ho*dx*To)/K)/(4+2*hinf*dx/K);
end
for j=1
T(i,j)=T(i,j-1)+T(i+1,j)+(q_dot*dx^2)/(2*K)+(ho*dx*To)/K;
end
for j=Ny*0.5
T(i,j)=(T(i,j+1)+2*T(i+1,j)+2*T(i,j+1)+T(i-1,j)+(3*q_dot*dx^2)/(2*K)+(2*ho*dx*To)/K)/(6+(2*ho*dx)/K);
end
else
T(i,j)=(T(i-1,j)+T(i+1,j)+T(i,j-1)+T(i,j+1)+(q_dot*dx^2)/K)/4;
end
end
end
Error=sqrt(sumsqr(T-Told));
disp(Error);
end
T(1:3,1) = To;
T(1:3,2)=To;
%% Graficando el resultado
x=0:dx:A;
y=0:dy:H;
% Definir los límites de color para resaltar variaciones
min_temp = min(min(T)); % Obtener el valor mínimo de temperatura
max_temp = max(max(T)); % Obtener el valor máximo de temperatura
colormap(hot); % Cambiar el colormap (puedes probar otros)
contourf(x, y, T', 'LineWidth', 1); % Añadir un grosor de línea para los contornos
colorbar;
title('Distribución de Temperatura')
xlabel('Dirección en x')
ylabel('Dirección en y')
% Establecer los límites de color para resaltar variaciones
clim([min_temp, max_temp]); % Establecer los límites de color según los valores mínimos y máximos de temperatura
Matlab show me that the next problem.
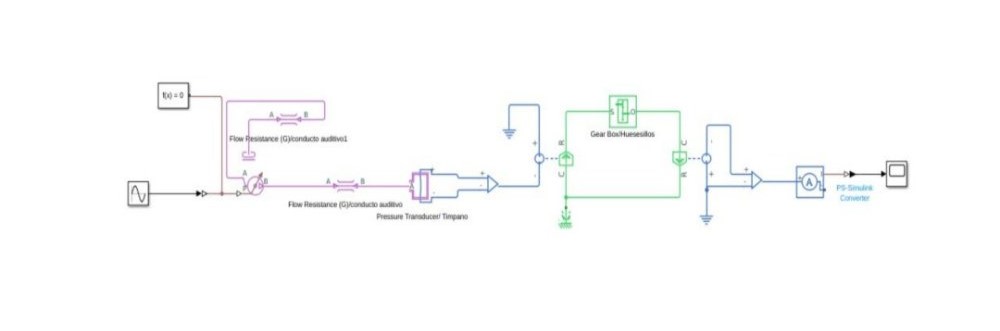
Tie variable 'Pressure_Transducer_Timpano.p.v' (Voltage) to a definite value, for example by connecting an appropriate domain reference block.
I don't know what I should do in it because I have done an model by hearing and use this object because I want to modelate a Timpanumm membrane. If you could help I really gratefully.
I will include the picture.
Dedicated to all Flipbook contest lovers! :D

Hi, I'm in truble because I have two programs with the same variables and parameters. The main of the study is to change a value and plot the results. The problem is that I want them on the same plot but I use the same name for the variabes in the two different programs so when I use some function to join the figures togheter matlab resets the values obtained in the first program and runs only the second one.
Is there a method to avoid changing all the names of the variables in one of the two programs (because they have something like 500 lines)?
I saw this post on Answers.
I was impressed at the capability of the AI, as I have been at other times when I posed a question to it, at least some of the time. So much so that I wondered...
What if the AI were automatically applied to EVERY question on Answers? Would that be a good or bad thing? For example, suppose the AI automatically offers an answer to every question as soon as it gets posted? Of course, users would still be allowed to post their own, possibly better answers. But would it tend to disincentivise individuals from ansering questions?
Perhaps as bad, would it push Answers into the mode of a homework solving forum? Since if every homework question gets a possibly pretty good automatic AI generated solution, then every student will just post all HW questions, and the forum would quickly become overwhelmed.
I suppose one idea could be to set up the AI to post an answer to all un-answered questions that are at least one month old. Then students would not gain by posting their homework.
In just one week, we have about 200 amazing animations! We see many creative and compelling animations and more importantly a lot of FUN!
Now, let the voting begin! Vote on the animations you love. Also, share them with your friends, classmates, or colleagues. Show the world the beauty of mathematics!
Mini Hack Winners - Week 1
You probably can imagine how hard it is to pick the winners, given so many awesome entries there are! We came up with several categories:
Landscape:
Trees:
Illusion:
Cartoon:
MATropolis:
Geometry:
Congratulations to the winners! Each of you won your choice of a T-shirt, a hat, or a coffee mug. We will contact you after the contest ends.
Finally, we encourage all of you to share your experiences, thoughts, and feedback in our new contest discussions channel!
Loving all the animations I'm seeing so far and feeling so inspired and impressed by what y'all are sharing. Thanks for loading me up with new topics to learn about!
Hi everyone,
I would like to ask you if it would be possible to do an HiL simulation using an environment model simulated via Simulink and load in a target computer connected to the hardware needed. The target computer will be simply a laptop with Matlab&Simulink package installed and directly connected to the bench to test.
I have found some solutions about the use of Simulink Real-Time but it implies the use of a Speedgoat unit, so I was wondering if anyone has ever done it without that device.
Thank you very much.
Hi, I'm trying to analyze a .vtk data set from MRI. I already calculate the kinetic energy. Now I'm trying to calculate the viscous energy loss but the result that I found does not respect the reality so I think that I'm doing something wrong.
Can someone help me with this?
%% FUNCTION
function energy_loss = calculateViscousEnergyLossForAllPhases(MRI_Velocity, dynamic_viscosity,interval)
% Preallocate the energy_dissipation array
energy_loss = zeros(1, 30);
for idx_phase = 1:30
% Velocity field
vel_x = MRI_Velocity{1, idx_phase}.velocity(:,1) * 1e-2; % Velocity in X from cm/s to m/s
vel_y = MRI_Velocity{1, idx_phase}.velocity(:,2) * 1e-2; % Velocity in Y in m/s
vel_z = MRI_Velocity{1, idx_phase}.velocity(:,3) * 1e-2; % Velocity in Z in m/s
% Coordinates
x = MRI_Velocity{1, idx_phase}.points(:,1) * 1e-3; % from mm to m
y = MRI_Velocity{1, idx_phase}.points(:,2) * 1e-3;
z = MRI_Velocity{1, idx_phase}.points(:,3) * 1e-3;
% Compute partial derivatives
dUdx = gradient(vel_x, x, 1);
dUdy = gradient(vel_x, y, 2);
dUdz = gradient(vel_x, z, 3);
dVdx = gradient(vel_y, x, 1);
dVdy = gradient(vel_y, y, 2);
dVdz = gradient(vel_y, z, 3);
dWdx = gradient(vel_z, x, 1);
dWdy = gradient(vel_z, y, 2);
dWdz = gradient(vel_z, z, 3);
% Calculate energy dissipation
ED = 2 * (dUdx.^2 + dUdy.^2 + dUdz.^2) + ...
2 * (dVdx.^2 + dVdy.^2 + dVdz.^2) + ...
2 * (dWdx.^2 + dWdy.^2 + dWdz.^2) + ...
(dUdz + dWdx).^2 + (dVdx + dUdy).^2 + (dWdy + dVdz).^2;
% Scale by dynamic viscosity of fluid and store
energy_loss(idx_phase) = sum(ED, 'all', 'omitnan') * dynamic_viscosity * interval.^3;
end
end
%% CODE
dynamic_viscosity_blood = 0.0039;
% human dynamic_viscosity_blood from 0.003 to 0.004; % Approximate value for blood at body temperature
% Call the function to calculate viscous energy loss for blood flow for all phases
energy_loss_RV_J = calculateViscousEnergyLossForAllPhases(MRI_Velocity_RV, dynamic_viscosity_blood,interval/1000);
energy_loss_LV_J = calculateViscousEnergyLossForAllPhases(MRI_Velocity_LV, dynamic_viscosity_blood,interval/1000);
% From Joule to milliwatt (mW)
energy_loss_RV_mW = energy_loss_RV_J.*1e3;
energy_loss_LV_mW = energy_loss_LV_J.*1e3;
figure
plot(time, energy_loss_RV_mW, 'r','LineWidth',1.5);
hold on
plot(time, energy_loss_LV_mW,'b','LineWidth',1.5);
title('Viscous energy loss over Cycle','FontSize',14);
xlabel('Cycle','FontSize',12);
ylabel('Viscous energy loss [mW]','FontSize',12);
legend('RV','LV')
Hi Guys
Posting this based on a thought I had, so I don't really ahve any code however I would like to know if the thought process is correct and/or relatively accurate.
Consider a simple spring mass system which only allows compression on the spring however when there is tension the mass should move without the effect of the spring distrupting it, thus the mass is just thrown vertically upwards.
The idea which I came up with for such a system is to have two sets of dfferential equations, one which represents the spring system and another which presents a mass in motion without the effects of the spring.
Please refer to the below basic outline of the code which I am proposing. I believe that this may produce relatively decent results. The code essentially checks if there is tension in the system if there is it then takes the last values from the spring mass differential equation and uses it as initial conditions for the differential equation with the mass moving wothout the effects of the spring, this process works in reverse also. The error which would exist is that the initial conditions applied to the system would include effects of the spring. Would there be a better way to code such behaviour?
function xp = statespace(t,x,f,c,k,m)
if (k*x(1)) positive #implying tension
**Use last time step as initial conditions**
**differential equation of a mass moving""
end
if x(1) negative #implying that the mass in now moving down therefore compression in spring
**Use last time step as initial conditions**
**differential equation for a spring mass system**
end
end
Hi Friends,
I'm looking for a matlab program which calculat deflection of simply supported tapered beam under uniform travers load.
Thank you for your help.
Hello, how can i write a combination of matrcies as follows L=[ai_j] of order 4,M of order 4, then S=[4*ai_j+M] of order 4. i mean each element in S is a matrex of order 4
The Flipbook contest is currently in full swing! It's been truly inspiring to see the incredible artwork you've all created using MATLAB! Checkout the gallery page if you haven't already.
We have some exciting news for our contestants today! In order to allow for more complex and unique creations, we've increased the MATLAB Evaluation timeout limit from 55 to 235 seconds!! So, don't hold back! Feel free to throw in those extra intricate lines of code without worrying about timeouts.
To all those already participating, we commend your efforts and encourage you to keep pushing your boundaries. And remember, there's always room for more. So, why not invite your friends and fellow MATLAB enthusiasts to join in the fun?
We also encourage everyone to engage in the contest discussions channel. Share your experiences, insights, and feedback about this contest. Your contributions enrich our community and help us improve future contests.
Looking forward to seeing more and more entries in coming weeks!
Hello,
I have an equation model following a law of type power: s=aN^b
For the measure equation, I have also a power law: m=cN^d
So I would like to have an extended Kalman Filter code in Matlab for this case. CAN YOU HELP ME PLEASE ?
hi there, my name is ayush. Im a bachelor student from india. I was doing a semester project in topology optimization. can you tell me how you run the file (https://www.topopt.mek.dtu.dk/apps-and-software/new-99-line-topology-optimization-code-written-in-matlab)in matlab. In one of your answers you provided the source, from there i got the matlab file. i was thinking of doing a project on it, but i cant run the file. its showing error.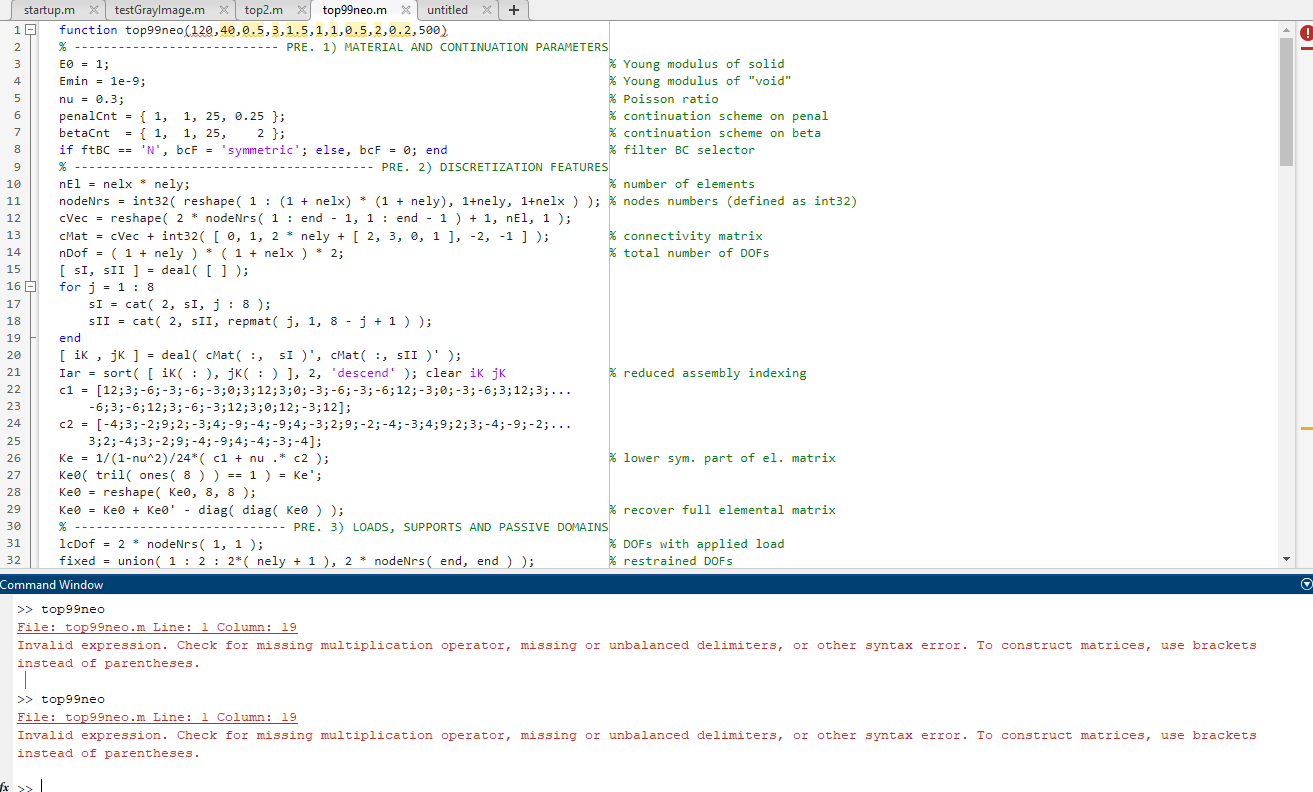
i provided the value of ftBC = 1. I have no priorknowledge of matlab. i want to learn it though.
We reached the 100 animations milestone in less than 3 days! We are thrilled to see so many creative entries and talented members learning from each other.
Note that this contest is not just for experts. People with all skill levels can participate, improve their MATLAB skills, and have fun!
We have created new resources and tips for you to get started.
- Contest introductory video. The 3-minute video provides you with a quick introduction to how the contest works and how to create a simple animation.
- Animations blog post. The post demonstrates some coding techniques that can make your animations easier.
- AI Chat Playground. This is a new community app we just released. You can leverage the Generative AI tool to write initial draft MATLAB code or modify existing one.
- Get ideas from previous Mini Hack contests. There is a large gallery of amazing images, which provide you with ideas and code to start with.
- Remix is highly encouraged. Learning from others is the most effective way to learn. Make some SMALL changes and see what it would look like.

We look forward to seeing more of you joining us and having more fun!
Hello.
I use readgeoraster to read in a 25MB geotiff. I then turn around and immediately write out the data with geotiffwrite. The resultant file is now 250MB.
What is the explanation for this 10x increase in file size? The data read in are 'single' format. And that is the exact data I am writing out.
Dave