Results for
The EMEA (Europe, Middle East and Africa) Academic Engineering Team are hosting a series of live online webinars every Tuesday and Wednesday. Get up to speed with online teaching and research with MATLAB and access ready-to-use resources.
Watch the introductory video and register here
Where is very courses and how to catch the courses
Hi Everyone,
Require some guidance and pointers on model ee_pmlsm_drive please.
Its regarding a PMSM linear machine model, with a cascade (position and speed) outer loop and a current controller inner loop (Id and Iq currents).
The current Simulink model uses a low voltage DC supply (48v) and uses a step input to the system. My system uses a HV source (400v) and the input is sinusoidal position, with an operating frequency range of 0 to 20hz.
I have used the original model, re-created my own (to learn Simulink/Simscape) with a HV battery source (400v) and used machine parameters that match the application (peer reviewed publication).
As my power electronics background is limited, my background is mechanical, i am unable to tune the inner and outer loops, and am unsure in what order to tune. My project is to use the linear PMSM to drive (motoring) a linear piston for combustion and also use the linear piston to drive the PMSM (generating).
Using the built in PID tuner for the outer speed and position loops i am encountering an error (plant cannot be linearised). I am using a simple 1 hz sine wave to simulate the reference position set-point. With all PID values set to default i have no dq currents, however i have idq ref from the outer velocity controller loop.
Any help with resources and guidance as to how to tune the loops for my updated parameters on this model would be great.
In this article, we discuss how educators can adopt simulation, alternative hardware, and other teaching resources to transition lab-based classes to distance learning: https://medium.com/mathworks/tips-for-moving-your-lab-based-classes-online-1cb53e90ee00.
Do you teach a lab-based class? Please share your thoughts, questions, experience, and feedback on these ideas here. I also welcome you to invite your colleagues to join the discussion here.
One community within MathWorks that has been helping students continue their learning is MATLAB Student Ambassadors. Despite new challenges with transitioning to distance learning, student ambassadors have done a truly amazing job. In a blog that was published recently, I discuss 3 examples of the great things that our student ambassadors have done to aid distance learning. Click here to read the blog. I hope after reading this blog you share my level of admiration for these students.
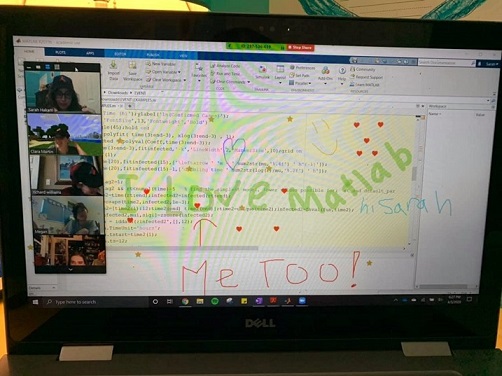
Student Ambassador at University of Houston hosting a fun and informative virtual event.


Today, I'm spotlighting Rik, our newest and the 31st MVP in MATLAB Answers. Two weeks ago, we just celebrated Ameer Hamza for reaching the MVP milestone. Today, we are thrilled that we have another new MVP!
Since his first answer in Feb 2017, Rik has been contributing high-quality answers every quarter!
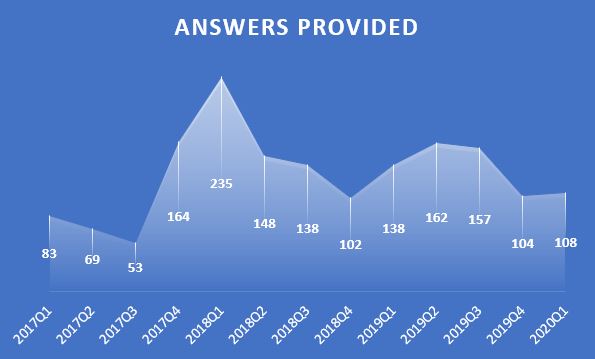
Besides those high-quality answers, Rik so far has submitted 21 files to File Exchange, one of which was chosen by MathWorks as the 'Pick of the Week'. Check the shining badge below.

Congratulations Rik! Thank you for your hard work and outstanding contributions.
hi how to apply single stream into multiple channels in fft simulink simulation from workspace
Sir how can we use Image processing in the Distance Learning
Hi, Currently modelling an reciprocating engine coupled to a linear PMSM motor/generator for my PhD. I have downloaded the "Model File Package for Motor Control Design Public Video" simulink model.
Is it possible to convert to rotational PMSM simscape plant model used for a linear PMSM model? As there are none in the library to just drag into the existing control model.
Any ideas i can represent a linear motor based on this existing control model?
My output from the machine needs to be linear position w.r.t, with a total stroke of approximately 100 mm. Can i convert the rotational constant speed input at port "W" to a sinusoidal velocity profile (such that it replicates the velocity profile of a linear machine)?
Any help would be great.
Thanks
Professor Martin Trauth has shared lots of teaching resources on his MATLAB Recipes for Earth Sciences site. Now with the changes created by COVID, he's shifting his courses to online, including at-home phone-based data collection. Read how he's doing this and find additional resources: Teaching Data Analysis with MATLAB in COVID-19 Times (Trauth, Potsdam)
Today, I’m spotlighting Ameer Hamza , our newest MVP in Answers. Achieving MVP status is considered as a significant milestone and we know how hard it is to obtain 5,000 reputation points. Did you know Ameer earned 3000+ points and provided 1000+ answers in just 2 months? If you go to the leaderboard , you will find that Ameer ranks 1st in both 7-day leaderboard and 30-day leaderboard.
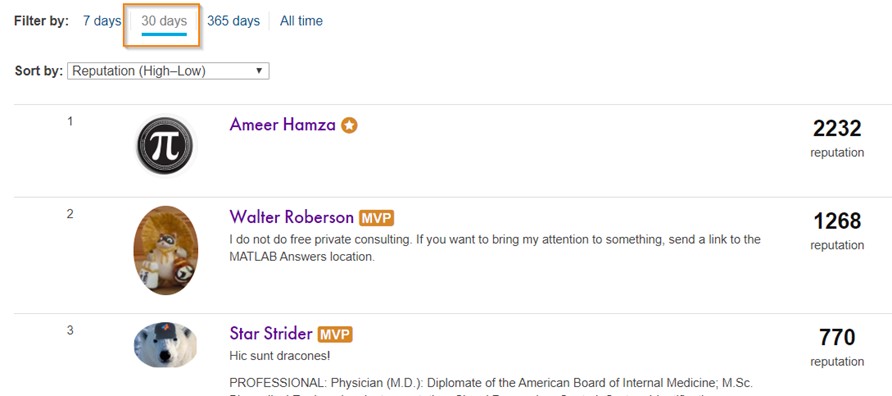
Due to Covid-19 pandemic, people have to stay at home and rely more on community for help. We have seen a significant increase in new questions per day. Luckily, we have a vibrant community! Many awesome contributors like Ameer double their effort to help people in need. Join me to thank Ameer and many other contributors!
A common question you may have when integrating MATLAB Grader into your LMS using the LTI standard is what information is being sent to MATLAB Grader from your LMS?
First, please familiarize yourself with the LTI specification on the IMS Global website: http://www.imsglobal.org/specs/ltiv1p1/implementation-guide
Next, take a look at the documentation we provide on LMS integration that is specific to your platform/vendor: https://www.mathworks.com/help/matlabgrader/lms-integration.html
MathWorks does not require personally identifiable information. More specifically, here are the standard LTI fields that we DO NOT want nor collect, as opposed to what fields we DO collect.
We do NOT want your LMS to send us: - user_image - lis_person_name_given - lis_person_name_family - lis_person_name_full - lis_person_contact_email
We DO require from your LMS: - roles
The other LTI fields listed in the specification are not related to personally identifiable information, and may be required for the LTI session to be launched successfully. For further questions about what is contained in the LTI specification, please refer to the specification and implementation guide provided by IMS, or contact the vendor of your LMS.
MathWorks
Accelerating the pace of engineering and science.
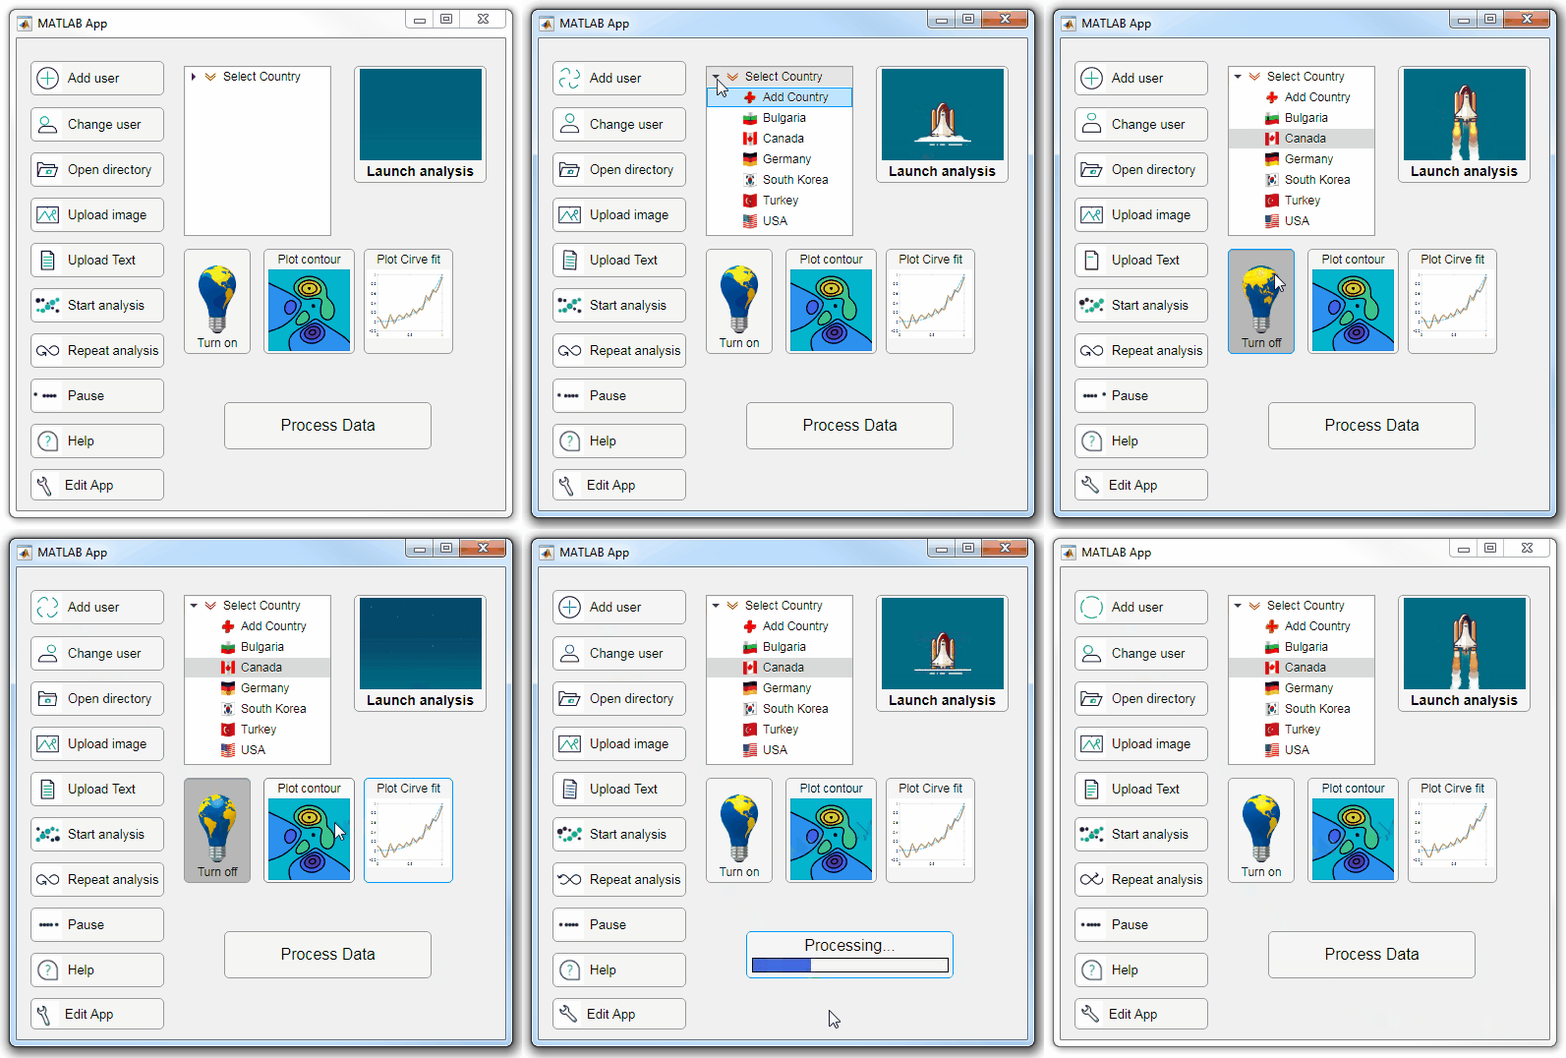
Starting in r2020a, AppDesigner buttons and TreeNodes can display animated GIFs, SVG, and truecolor image arrays.
Every component in the App above is either a Button or a TreeNode!
Prior to r2020a the icon property of buttons and TreeNodes in AppDesigner supported JPEG, PNG, or GIF image files specified by a character vector or string array but did not support animation.
Here's how to display an animated GIF, SVG, or truecolor image in an App button or TreeNode starting in r2020a. And for the record, "GIF" is pronounced with a hard-g .
Display an animated GIF
Select the button or TreeNode from within AppDesigner > Design View and navigate to Component Browser > Inspector > Button dropdown list of properties (shown below). Select an animated GIF file and set the text and icon alignment properties.
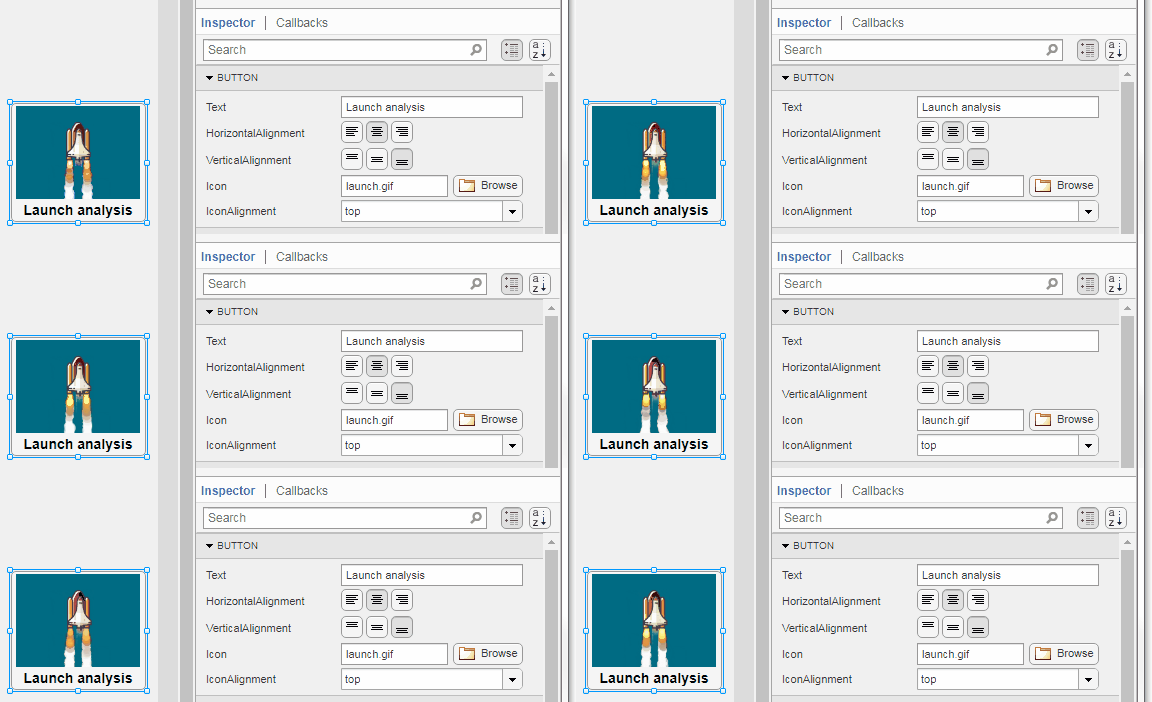
To set the icon property programmatically,
app.Button.Icon = 'launch.gif'; % or "launch.gif"
The filename can be an image file on the Matlab path (see addpath ) or a full path to an image file.
Display SVG
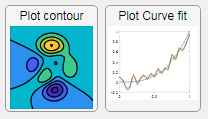
Use “scalable vector graphics” files for high-resolution images that are scaled to different sizes while preserving their shape and retaining their clarity. A quick and easy way to remember which plotting function is assigned to each button in an app is to assign an image of the plot to the button.
After creating the figure, expand the axes by setting the position or outerposition property to [0 0 1 1] in normalized units and save the figure using File > Save as and select svg format. Save the image to the folder containing your app. Then follow the same procedure as animated GIFs.
Display truecolor image
A truecolor image comes in the form of an [m x n x 3] array where each m x n pixel color is specified by an RGB triplet (read more) . This feature allows you to dynamically create a digital image or to upload an image from a mat file rather than an image file.
In this example, a progress bar is created within the uibutton callback function and it’s updated within a loop. For a complete demo of this feature see this comment .

% Button pushed function: ProcessDataButton
function ProcessDataButtonPushed(app, event)
    % Change button name to "Processing"
    app.ProcessDataButton.Text = 'Processing...';
    % Put text on top of icon
    app.ProcessDataButton.IconAlignment = 'bottom';
    % Create waitbar with same color as button
    wbar = permute(repmat(app.ProcessDataButton.BackgroundColor,15,1,200),[1,3,2]);
    % Black frame around waitbar
    wbar([1,end],:,:) = 0;
    wbar(:,[1,end],:) = 0;
    % Load the empty waitbar to the button
    app.ProcessDataButton.Icon = wbar;
    % Loop through something and update waitbar
    n = 10;
    for i = 1:n
        % Update image data (royalblue)
        % if mod(i,10)==0 % update every 10 cycles; improves efficiency
         currentProg = min(round((size(wbar,2)-2)*(i/n)),size(wbar,2)-2);
         RGB = app.ProcessDataButton.Icon;
         RGB(2:end-1, 2:currentProg+1, 1) = 0.25391; % (royalblue)
         RGB(2:end-1, 2:currentProg+1, 2) = 0.41016;
         RGB(2:end-1, 2:currentProg+1, 3) = 0.87891;
           app.ProcessDataButton.Icon = RGB;
          % Pause to slow down animation
          pause(.3)
          % end
      end
      % remove waitbar
      app.ProcessDataButton.Icon = '';
      % Change button name
      app.ProcessDataButton.Text = 'Process Data';
  end
The for-loop above was improved on Feb-11-2022.
Credit for the black & teal GIF icons: lordicon.com
can anyone advise which Matlab code I can add to the below codes to have Spectrogram Plot?
OptimalValuesx1y1z1 = [dataArray{1:end-1}];
%% Clear temporary variables
clearvars filename delimiter formatSpec fileID dataArray ans;
re=1;
fs=20e3/re;
datatable=OptimalValuesx1y1z1;
datatable=resample(OptimalValuesx1y1z1,1,re);
%datatable=lowpass(OptimalValuesx1y1z1,10,fs);
datatable(:,2)=datatable(:,2).*0.01;
figure
t=1/fs:1/fs:length(datatable)/fs;
plot(t, rms(datatable(:,2:4)*9.81,3));
ylim([0 10])
xlim([0 10])
%ylim([0 1])
hold on
%plot(t,ones(1,length(datatable(:,2:4)*9.81))*12,'r--')
xlabel('Time [s]')
ylabel('Amplitude [m/s^2]')
legend('axis X','axis Y','axis Z','limit')
out_mean = mean(rms(datatable(:,2:4),3))
std_mean = std(rms(datatable(:,2:4),3))
% %PSD analysis
figure
x=datatable(:,2:4)*9.81;
nbar = 4;
sll = -30;
win = taylorwin(length(x),nbar,sll);
periodogram(x,win,[],fs);
xlim([0 1.624])
legend('axis X','axis Y','axis Z')
plz tell me the web site where i can easily install mathlab.
I want to use the Image fusions and deep neural network to detect the Corona-virus (COVID-19)
Hello, I want to generate Sinusoidal PWM for 3 level inverter. But I can not finding the way of connect these blocks togather. Is it possible to conenct them? Is there any other way to generate SPWM in simulink?
The File Exchange team is excited to announce that File Exchange now supports GitHub Releases!
Contributors can now develop software projects in GitHub without having to manually sync and maintain the same code in File Exchange.
To start using this feature, choose 'GitHub Releases' option when you update your existing File Exchange submission or link a new repository to File Exchange.
When you link your GitHub repository to File Exchange using GitHub Releases, your File Exchange submission will automatically update when you create a new release in GitHub that is compatible with File Exchange. In addition, if you package your code as a toolbox (.mltbx) and attach the toolbox package to your latest GitHub release, File Exchange will provide the toolbox to your users for download. If you do not attach a toolbox to the release, File Exchange will provide the zip release asset for download.
See this page for more details.
We encourage you to try out this feature and let us know of any feedback you have by replying below.

