Results for
I have written, tested, and prepared a function with four subsunctions on my computer for solving one of the problems in the list of Cody problems in MathWorks in three days. Today, when I wanted to upload or copy paste the codes of the function and its subfunctions to the specified place of the problem of Cody page, I do not see a place to upload it, and the ability to copy past the codes. The total of the entire codes and their documentations is about 600 lines, which means that I cannot and it is not worth it to retype all of them in the relevent Cody environment after spending a few days. I would appreciate your guidance on how to enter the prepared codes to the desired environment in Cody.
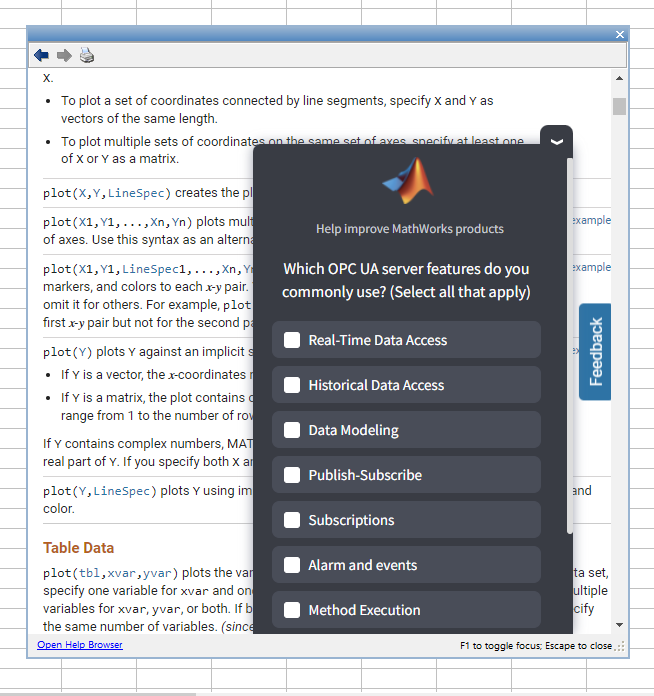
I'm getting this annoying survey (screenshot below) in the help windows of MATLAB R2024b this morning. It blocks the text I'm actually trying to read, when minimised it pops up again after a few minutes, and persists even after picking an option and completing the SurveyMonkey survey it links to. I don't even know what the OPC UA server so rest assured any of my answers to that survey aren't going to help MathWorks improve their product.
It is April 3, 2025 now. Where is the MATLAB 2025a?
ho questo codice matlab, vorrei creare un grafico inerente all'andamento di c1,c2,cm al variare di d1, purtroppo mi da sempre lo stesso errore horzcat, inerente alle dimensioni delle matrici , nonostante le dimensioni siano corrette e uguali
I hope you well receive this messege as well.
I am happy jion for your site.
I start to do project on UAV
kindy could you please send me you tube, documets regarding to quadrotror mathlab simulink?
Please help me
%% 清理环境
close all; clear; clc;
%% 模拟时间序列
t = linspace(0,12,200); % 时间从 0 到 12,分 200 个点
% 下面构造一些模拟的"峰状"数据,用于演示
% 你可以根据需要替换成自己的真实数据
rng(0); % 固定随机种子,方便复现
baseIntensity = -20; % 强度基线(z 轴的最低值)
numSamples = 5; % 样本数量
yOffsets = linspace(20,140,numSamples); % 不同样本在 y 轴上的偏移
colors = [ ...
0.8 0.2 0.2; % 红
0.2 0.8 0.2; % 绿
0.2 0.2 0.8; % 蓝
0.9 0.7 0.2; % 金黄
0.6 0.4 0.7]; % 紫
% 构造一些带多个峰的模拟数据
dataMatrix = zeros(numSamples, length(t));
for i = 1:numSamples
% 随机峰参数
peakPositions = randperm(length(t),3); % 三个峰位置
intensities = zeros(size(t));
for pk = 1:3
center = peakPositions(pk);
width = 10 + 10*rand; % 峰宽
height = 100 + 50*rand; % 峰高
% 高斯峰
intensities = intensities + height*exp(-((1:length(t))-center).^2/(2*width^2));
end
% 再加一些小随机扰动
intensities = intensities + 10*randn(size(t));
dataMatrix(i,:) = intensities;
end
%% 开始绘图
figure('Color','w','Position',[100 100 800 600],'Theme','light');
hold on; box on; grid on;
for i = 1:numSamples
% 构造 fill3 的多边形顶点
xPatch = [t, fliplr(t)];
yPatch = [yOffsets(i)*ones(size(t)), fliplr(yOffsets(i)*ones(size(t)))];
zPatch = [dataMatrix(i,:), baseIntensity*ones(size(t))];
% 使用 fill3 填充面积
hFill = fill3(xPatch, yPatch, zPatch, colors(i,:));
set(hFill,'FaceAlpha',0.8,'EdgeColor','none'); % 调整透明度、去除边框
% 在每条曲线尾部标注 Sample i
text(t(end)+0.3, yOffsets(i), dataMatrix(i,end), ...
['Sample ' num2str(i)], 'FontSize',10, ...
'HorizontalAlignment','left','VerticalAlignment','middle');
end
%% 坐标轴与视角设置
xlim([0 12]);
ylim([0 160]);
zlim([-20 350]);
xlabel('Time (sec)','FontWeight','bold');
ylabel('Frequency (Hz)','FontWeight','bold');
zlabel('Intensity','FontWeight','bold');
% 设置刻度(根据需要微调)
set(gca,'XTick',0:2:12, ...
'YTick',0:40:160, ...
'ZTick',-20:40:200);
% 设置视角(az = 水平旋转,el = 垂直旋转)
view([211 21]);
% 让三维坐标轴在后方
set(gca,'Projection','perspective');
% 如果想去掉默认的坐标轴线,也可以尝试
% set(gca,'BoxStyle','full','LineWidth',1.2);
%% 可选:在后方添加一个浅色网格平面 (示例)
% 这个与题图右上方的网格类似
[Xplane,Yplane] = meshgrid([0 12],[0 160]);
Zplane = baseIntensity*ones(size(Xplane)); % 在 Z = -20 处画一个竖直面的框
surf(Xplane, Yplane, Zplane, ...
'FaceColor',[0.95 0.95 0.9], ...
'EdgeColor','k','FaceAlpha',0.3);
%% 进一步美化(可根据需求调整)
title('3D Stacked Plot Example','FontSize',12);
constantplane("x",12,FaceColor=rand(1,3),FaceAlpha=0.5);
constantplane("y",0,FaceColor=rand(1,3),FaceAlpha=0.5);
constantplane("z",-19,FaceColor=rand(1,3),FaceAlpha=0.5);
hold off;

Have fun! Enjoy yourself!
Hello Community,
We're excited to announce that registration is now open for the MathWorks AUTOMOTIVE CONFERENCE 2025! This event presents a fantastic opportunity to connect with MathWorks and industry experts while exploring the latest trends in the automotive sector.
Event Details:
- Date: April 29, 2025
- Location: St. John’s Resort, Plymouth, MI
Featured Topics:
- Virtual Development
- Electrification
- Software Development
- AI in Engineering
Whether you're a professional in the automotive industry or simply interested in these cutting-edge topics, we highly encourage you to register for this conference.
We look forward to seeing you there!
We are excited to announce another update to our Discussions area: the new Contribution Widget! The new widget simplifies the process of creating diverse types of content, whether you're praising someone who has helped you, sharing tips and tricks, or polling the community.

Previously, creating various types of content required navigating multiple links or channels. With the new Contribution Widget, everything you need is conveniently located in one place.
Give it a try and let us know how we can further enhance your user experience.
P.S. Who has been particularly helpful to you lately? Create your first praise post and let them know!
We are excited to announce the first edition of the MathWorks AI Challenge. You’re invited to submit innovative solutions to challenges in the field of artificial intelligence. Choose a project from our curated list and submit your solution for a chance to win up to $1,000 (USD). Showcase your creativity and contribute to the advancement of AI technology.
I am trying to integrate an external C++ function (large package) into a mex function. I have written a cmake file, which generates library for external C++ function and I am using matlab_add_mex to generate the mex-file.
# Find MATLAB
set(Matlab_ROOT_DIR "../mathworks/2023b/bin/")
find_package(Matlab REQUIRED)
# Add a MEX target
matlab_add_mex(
NAME my_mex_function
SRC my_mex_function.cpp
LINK_TO my_library
)
find_package(Matlab REQUIRED) - gives following error:
CMake Error at CMakeLists.txt: (find_package):
By not providing "Findmatlab.cmake" in CMAKE_MODULE_PATH this project has asked CMake to find a package configuration file provided by "matlab", but CMake did not find one.
Could not find a package configuration file provided by "matlab" with any of the following names:
matlabConfig.cmake
matlab-config.cmake
Add the installation prefix of "matlab" to CMAKE_PREFIX_PATH or set "matlab_DIR" to a directory containing one of the above files. If "matlab" provides a separate development package or SDK, be sure it has been installed.
I searched for matlabConfig.cmake or matlab-config.cmake in matlab installation directory but did not find it. Does Matlab provide provide such files or not? If not how to integrate large C++ programs with MATLAB. I dont want to use system function calls as they are too slow.
There has been a lot of discussion here about the R2025a Prerelease that has really helped us get it ready for the prime time. Thank you for that!
A new update of the Prerelease has just dropped. So fresh it is still warm from the oven! In my latest blog post I discuss changes in the way MathWorks has been asking-for and processing feedback...and you have all been a part of that.
If you haven't tried the Prerelease in a while, I suggest you update and see how things are looking now.
If you have already submitted a bug report and it hasn't been fixed in this update, you don't need to submit another one. Everything is being tracked!
Have a play, discuss it here and thanks for again for being part of the process.
Bonsoir,
Je suis en train de finaliser Module 4 du cours "Designing and Simulating Physical Models" et j’ai quelques difficultés avec les derniers quiz, notamment ceux liés au projet Simulating Motor Heat Effects.
J’ai suivi toutes les étapes du projet et compris l’utilisation des blocs Relay, PS Product et Thermal Mass, mais j’aimerais avoir des clarifications sur :
Comment tester efficacement mon modèle pour vérifier que la logique de coupure fonctionne bien ?
Quels paramètres thermiques sont les plus critiques pour éviter les erreurs de simulation ?
Y a-t-il des erreurs fréquentes à éviter dans les quiz finaux ?
Si quelqu’un a réussi ces quiz et peut me donner quelques conseils ou orientations, ce serait super !
Merci beaucoup pour votre aide.
📢 We want to hear from you! We're a team of graduate student researchers at the University of Michigan studying MATLAB Drive and other cloud-based systems for sharing coding files. Your feedback will help improve these tools. Take our quick survey here: https://forms.gle/DnHs4XNAwBZvmrAw6
Hello,
I hope you are doing well. I need your help in developing a Matlab model for the modeling and simulation of the energy and environmental performance of an improved stove (furnace) for the combustion of charcoal briquettes (biochar). I would really appreciate your assistance.
Thank you very much.
name for each component
Hi! I am using F28379D DSP. I would like to generate 20khz and 50% duty cycle. I have use ADC with the input 3Vac from voltage sensor. The TBPRD set is 2500 and the CMP value is 1250 with prescaler 1. EPWM1A and EPWM 1B are utilised in this case. Unfortunately EPWM1A duty cycle is shifting/moving/not in phase, EPWM1B is constantly producing 20khz. I am using updown counter. CAU is set CAD is Clear same goes to EPWM1B. Why this happen? I would like to do a switching where PWM 20khz is on during positive half cycle, PWM 20khz is off during negative half cycle. Appreciate for the help!
No
50%
Yes, but I am not interested
8%
Yes, but it is too expensive
20%
Yes, I would like to know more
18%
Yes, I am cert. MATLAB Associate
2%
Yes, I am cert. MATLAB Professional
3%
4779 votes
Hello MATLAB Community,
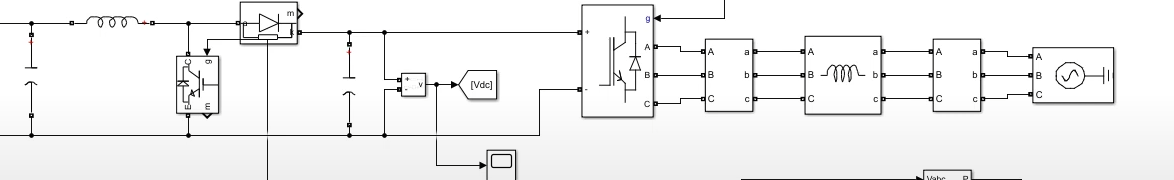
I'm working on a project where I need to model and simulate a generator or motor system in Simulink, and I want to get the output voltage based on certain design parameters, including the number of turns, magnets, and coils.
I’m looking for a Simulink model or component that would allow me to input:
- The number of turns in the coils
- The number of magnets
- The number of coils
And then, based on this design, output the voltage generated by the system.
I would appreciate any guidance on:
- Specific Simulink components or models that are suited for this purpose
- Whether there’s a prebuilt block or if I need to build a custom model
- Any tips or examples that can help me set up this simulation
Thanks in advance for your help!
Best regards,
Siyabonga
Over the last 5 years or so, the highest-traffic post on my MATLAB Central image processing blog was not actually about image processing; it was about changing the default line thickness in plots.
Now I have written about some other MATLAB plotting behavior that I have recently changed to suit my own preferences. See this new blog post.
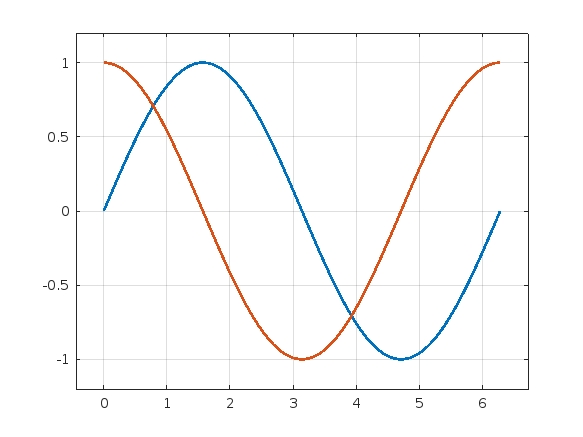
Here is a standard MATLAB plot:
x = 0:pi/100:2*pi;
y1 = sin(x);
y2 = cos(x);
plot(x,y1,x,y2)

I don't like some aspects of this plot, and so I have put the following code into my startup file.
set(groot,"DefaultLineLineWidth",2)
set(groot,"DefaultAxesXLimitMethod","padded")
set(groot,"DefaultAxesYLimitMethod","padded")
set(groot,"DefaultAxesZLimitMethod","padded")
set(groot,"DefaultAxesXGrid","on")
set(groot,"DefaultAxesYGrid","on")
set(groot,"DefaultAxesZGrid","on")
With those defaults changed, here is my preferred appearance:
plot(x,y1,x,y2)
To develop uifigure-based app, I wish MATLAB can provide something like uiquestdlg to replace questdlg without changing too much of the original code developed for figure-based app. Also, uiinputdlg <-> inputdlg and so on.