Results for
Good day community, can I know what is this symbol could be? It looks like a ramp/ continuous ramp. But I believe it is not both them. I saw someone connect it after a voltage/ current measurement. Can I know what is the function of this symbol too? Much appreciate for the answers given
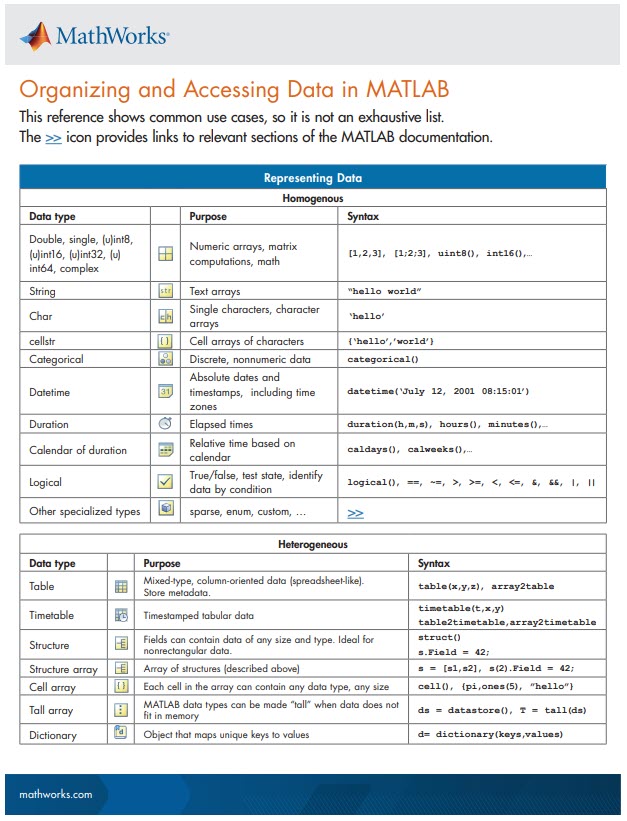
New Cheat Sheet Alert!
Level up your data organization and access skills in MATLAB with our latest cheat sheet! Download the full cheat sheet on MATLAB GitHub for Students here.
I rarely/never save .fig files
47%
Continue working on it later
16%
Archive for future reference
23%
Share within my organization
10%
Share outside my organization
2%
Other (please leave a comment)
2%
2097 votes
Hello All,
I was wondering, from which version Tracebility Diagrams are available (in SLK Req)?
Regards
Abhishek KUMAR
Hello, I am trying to use a Velodyne VLP 16 Puck Lidar, to receive live data (visualized) as well as point cloud, the issue I have is; I do actually run the code to visualize the lidar and I can see the live map, as well as I get frames in the work space as (1x1 Pointcloud), now how can I process these pointclouds(from the live stream of lidar), I would like to denoise them, downsample, etc. I tried going through alot of toolboxes but I usually get stuck, need tips and how to start working, thanks.,
unable to download and cant install Arduino third party packages , but support packeages are download, 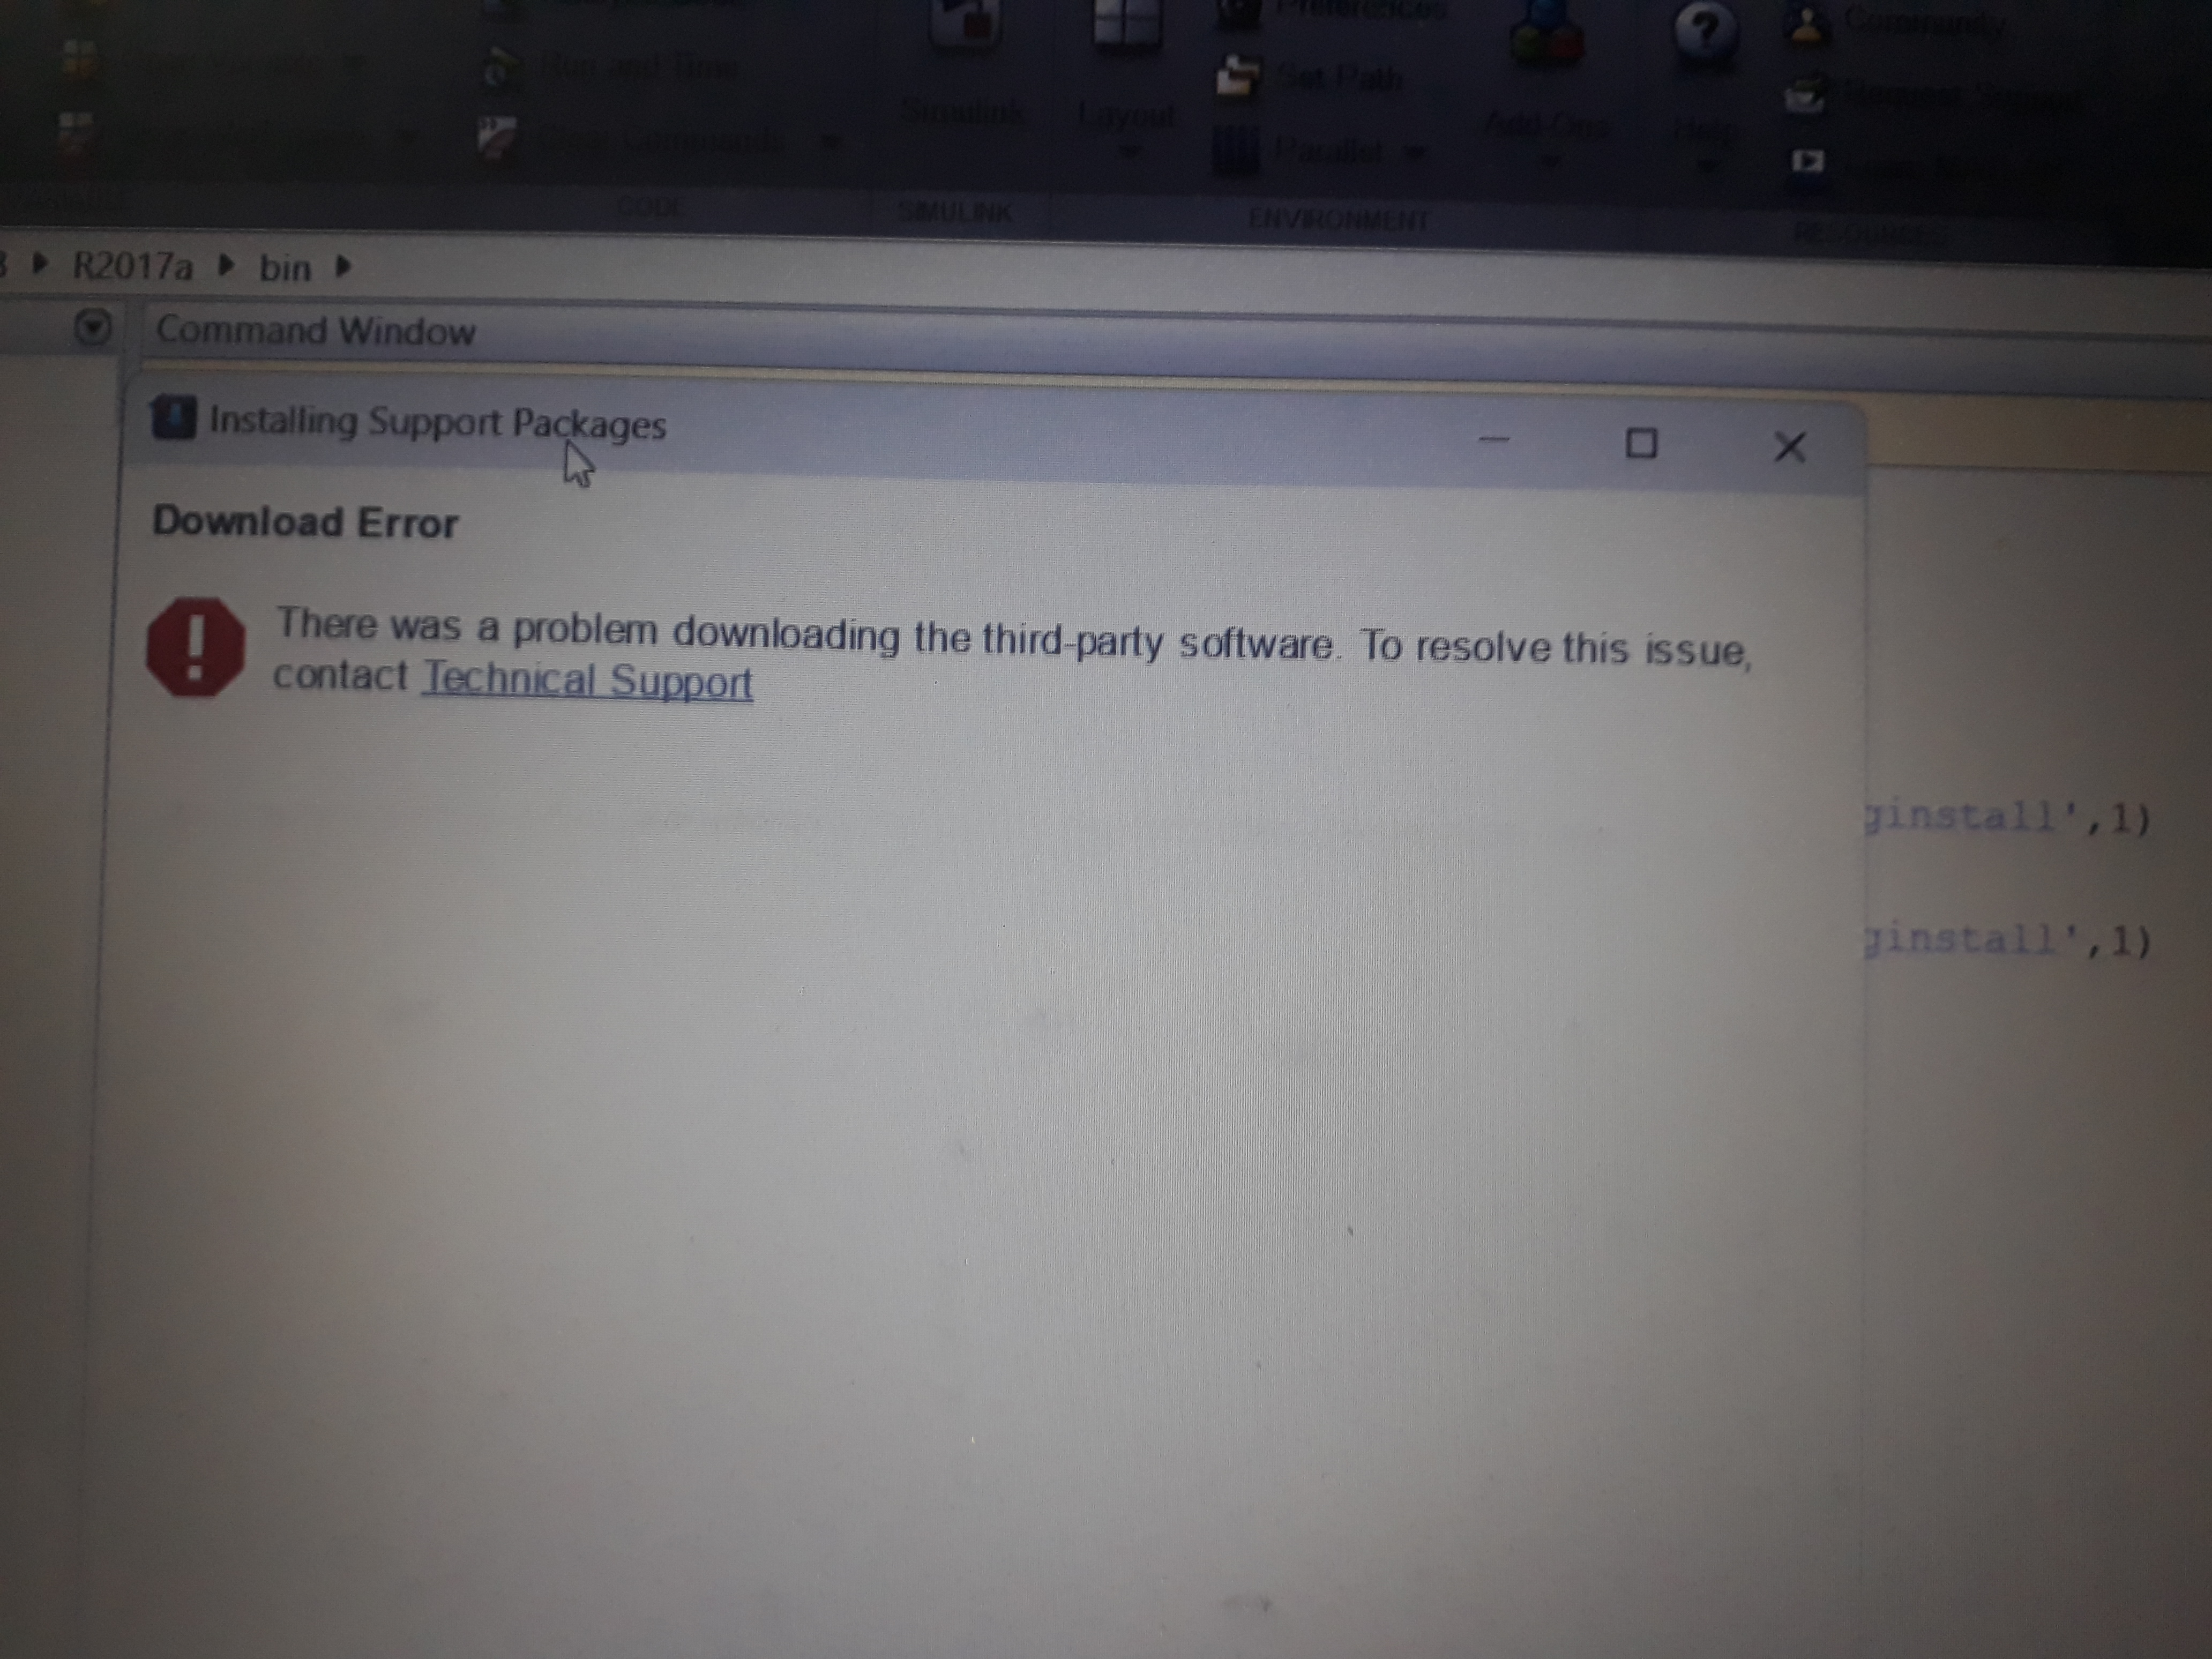
- Why do the stations transmit to each other while there is no association among them?
- How the stations transmit to the access point while the traffic generation is one way?
please find the attached code"ex1_AP_STA.m" and output data of simulator "Simulation data.zip"
when i use command openExample('px4/PX4HITLSimulationFixedWingPlantSimulinkExample'),matlab shows "PX4HITLSimulationFixedWingPlantSimulinkExample" cannot find. So does somebody know how to find this demo? Thanks.
ncorr is not working on MATLAB 2023b new version, it gives me an error. Does somebody know why? Thanks
I know the latest version of MATLAB R2023b has this feature already, put it should be added to R2023a as well because of its simplicity and convenience.
Basically, I want to make a bar graph that lets me name each column in a basic bar graph:
y=[100 99 100 200 200 300 500 800 1000];
x=["0-4" "5-17" "18-29" "30-39" "40-49" "50-64" "65-74" "75-84" "85+"];
bar(x,y)
However, in R2023a, this isn't a feature. I think it should be added because it helps to present data and ideas more clearly and professionally, which is the purpose of a graph to begin with.
Dear all,
In an excel file, we have temperature (te) and humidity (hu) data in two columns. The Gaussian kernel-density estimation and best-fit quadratic curve were plotted. However, we need to determine whether the relationship is statistically significant or not, as well as the coefficient of determination (R2). For calulation of the both of them, we used functions like:
2. statistically significant p= coefTest(aa)
Is it correct? If not, please provide the any other suggestions.
Thank you.
For example, my main line chart have values: X=[10 20 30 40 50] Y=[0.5 1.5 5 -6 4]. I need to add second X axis, with value [1 2 3 4 5] but but I would like the distance between individual points to be variable. For example, between points 1-2 d=25, between 2-3 d=10. I would like to define this distance freely.
xt = e^-3t
ht= -5e^-2t +6e^-3t
so ofcourse these would be used to plot yt which is xt*ht in other words xt conv ht. Thanks for your assistance!!
Recently, I came across a post about the JIT compiler on this Korean blog. In the post. The writer discussed the concept of the "Compile Threshold" and how it is calculated.
"The JVM accumulates the number of calls for each method called and compiles when the number exceeds a certain number. In other words, there is a standard for checking how often it is called and then deciding, 'It is time to compile.' This standard is called the compilation threshold. But what is this and why should it be used as a standard?"
The concept of the "Compile Threshold," as used above, seems to be more commonly associated with Tracing just-in-time compilation.
The writer used the simple Java code below to calculate the threshold.
for (int i = 0; i < 500; ++i) {
long startTime = System.nanoTime();
for (int j = 0; j < 1000; ++j) {
new Object();
}
long endTime = System.nanoTime();
System.out.printf("%d\t%d\n", i, endTime - startTime);
}
Since the MATLAB execution engine uses JIT compilation, I just wanted to perform the same experiment that the writer did.
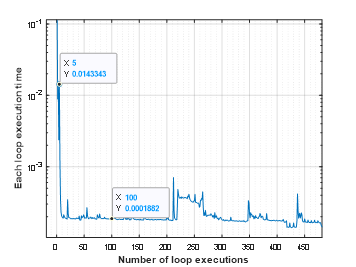
I experimented using simple codes based on the code in the blog. I iterated a function 500 time using for-loop and calculated the execution time for each iteration using tic and toc. Then I plotted the execution time for each loop as blow. First five execution times are much higher than followings (10 times!) The test is very rough so I am not sure that I can conclude "MATLAB has Compile Threshold and it is 5!" but this value is actually correct ;-)
t0 = 0;
tfinal = 10;
y0 = [20;20];
timeToRun = zeros(500,1);
for i = 1:500
tStart = tic;
[preypeaks,predatorpeaks] = solvelotka(t0, tfinal, y0);
tEnd = toc(tStart);
timeToRun(i) = tEnd;
end
VS Code Extension for MATLAB was introduced back in April and has been downloaded 75K times since. Do people here use VS Code for writing MATLAB code?
Would it be a good thing to have implicit expansion enabled for cat(), horzcat(), vertcat()? There are often situations where I would like to be able to do things like this:
x=[10;20;30;40];
y=[11;12;13;14];
z=cat(3, 0,1,2);
C=[x,y,z]
with the result,
C(:,:,1) =
10 11 0
20 12 0
30 13 0
40 14 0
C(:,:,2) =
10 11 1
20 12 1
30 13 1
40 14 1
C(:,:,3) =
10 11 2
20 12 2
30 13 2
40 14 2
Earlier this year a bunch of MATLAB users got together to talk about their hobbies in a lightning talk format.
- Using "UIHTML" to create app components and Lightning
- Creating generative art with MATLAB
- Making MATLAB run on the Steam Deck (it was a wager)
Do you use MATLAB for hobbies?
Hi,
I'm trying to use subs to subsitute x and y coordinates into a symbolic equation so I can solve it for the value at each coordinate. Below is how my code is currently sctructured.
%% Creating Fluid Equations
syms x y
vel_x = sin(x) + cos(y);
vel_y = cos(x)^2 + sin(y)^0.5;
pressure = 101300 * (x*exp(y));
density = 1.2 * (x^2 + y^0.5);
%% Plotting Fluid Equations
x_input = 0:0.1:10;
y_input = 0:0.1:10;
[x_coord, y_coord] = meshgrid(x_input, y_input);
% Subsitute symbolic variables with x and y arrays and turn into array of
% doubles
vel_x = double(subs(vel_x, [x, y], {x_coord, y_coord}));
vel_y = double(subs(vel_y, [x, y], {x_coord, y_coord}));
pressure = double(subs(pressure, [x, y], {x_coord, y_coord}));
density = double(subs(density, [x, y], {x_coord, y_coord}));
surf(x_input, y_input, vel_x)
This code is already taking 5 whole seconds to run and ideally I'd like to increase the density of coordinates. I was trying to stay away from using for loops wich is how I ended up using meshgrid and subs instead. How can I make this much more efficient?
Any advice would be much appreciated thank you!
Is there a way to generate "typedef short int" and typedef "unsigned short int"? I want this for my harware but what I get is only "typedef int" and typedef "unsigned int" irrespective of various hardware I selected including custom hardware.
Are there Matlab features which intend to satisfy your needs but fail in certain critical areas, forcing you to abandon them completely in favor of your own version or a 3rd party alternative? Perhaps these features are starting to improve with new Matlab releases, but not quickly enough? Share your own frustrations in the comments below.
Here are two of mine:
1. volumeViewier
volumeViewer is 6 years old now. It is fine when you only need to view one 3D image at a time, but I never do. In my work, I am putting several images side-by-side for visual comparison. For such work, you need to be able to programmatically change axis limits and grayscale and use linkprop to reflect these changes across all the images. With 2D image comparison, all that is possible, but volumeViewer supports none of those things. So, I resort to my own 3D viewer
2.Tomographic projection commands RADON and FANBEAM
These commands are provided in the Image Processing Toolbox seemingly for no other reason than to support homework exercises for people taking introductory tomographic imaging courses. They fail in a number of ways for people who need to do serious tomographic imaging work, producing artifacts or nonlinear effects which shouldn't be there. See for example Why isn't FANBEAM linear? or Radon Transform works unexpectedly. Moreover, the toolbox still provides tomographic projectors only for 2D imaging not 3D, even though 64-bit RAM has made volumetric imaging commonplace in Matlab for at least 10 years. Luckily, there are now freely available 3rd party alternatives like TIGRE.