Results for
I'm logging data which I'd like to see on a daily basis. ie each day the chart x axis resets to 12midnight to 12midnight for the current day and just shows todays data. Is this possible please ?
What amazing animations can be created with no more than 2000 characters of MATLAB code? Check out our GALLERY from the MATLAB Flipbook Mini Hack contest.
Vote on your favorite animations before Dec. 3rd. We will give out MATLAB T-shirts to 10 lucky voters!


Tips: the more you vote, the higher your chance to win.
Hello
I have been using ThingSpeak for about 2 years with no problems. I am observing sensor data and connecting widgets to some of the values. Since yesterday, there are some of the widgets that send blank values. Have you changed something?
Thank you
Hello, I would like to send temperature and humidity data from my ThingSpeak channel to the https://www.wunderground.com/ service. I managed to configure the initial connection through ThingHTTP, and on the WeatherUnderground website, there is information about data updates, but there are no actual values: https://www.wunderground.com/dashboard/pws/IKORON5/table/2023-11-19/2023-11-19/daily
I don't know how to correctly configure all the options in ThingHTTP and in the Apps - React section.
I think it would be a really great feature to be able to add an Alpha property to the basic "Line" class in MATLAB plots. I know that I have previously had to resort to using Patch to be able to plot semitransparent lines, but there are also so many other functions that rely on the "Line" class.
For example, if you want to make a scatter plot from a table with things specified into groups, you can use ScatterHistogram or gscatter but since gscatter uses the Line class, you can't adjust the marker transparency. So if you don't want the histograms, you are stuck with manually separating it and using scatter with hold on.
Hi Guys
Posting this based on a thought I had, so I don't really ahve any code however I would like to know if the thought process is correct and/or relatively accurate.
Consider a simple spring mass system which only allows compression on the spring however when there is tension the mass should move without the effect of the spring distrupting it, thus the mass is just thrown vertically upwards.
The idea which I came up with for such a system is to have two sets of dfferential equations, one which represents the spring system and another which presents a mass in motion without the effects of the spring.
Please refer to the below basic outline of the code which I am proposing. I believe that this may produce relatively decent results. The code essentially checks if there is tension in the system if there is it then takes the last values from the spring mass differential equation and uses it as initial conditions for the differential equation with the mass moving wothout the effects of the spring, this process works in reverse also. The error which would exist is that the initial conditions applied to the system would include effects of the spring. Would there be a better way to code such behaviour?
function xp = statespace(t,x,f,c,k,m)
if (k*x(1)) positive #implying tension
**Use last time step as initial conditions**
**differential equation of a mass moving""
end
if x(1) negative #implying that the mass in now moving down therefore compression in spring
**Use last time step as initial conditions**
**differential equation for a spring mass system**
end
end
when I examine the data stream on an arduino ide I get a lot of "stuff" which I dont understand.
1 what does it mean?
2 how do I prevent it?
Seeing a colleague make this mistake (one I've had to fix multiple times in other's work too) makes me want to ask the community: would you like the awgn() function/blocks to give the option for creating a SNR at the bandwidth of the signal? Your typical flow is something like this:
- Create a signal, usually at some nominal upsampling factor (e.g., 4) such that it's now nicely over sampled, especially if you're using a RRC or similar pulse shaping filter.
- Potentially add a frequency offset (which might make the sample frequency even higher)
- Add AWGN channel model for a desired SNR
- Put this into your detector/receiver model
The problem is, when someone says, "I'm detecting XYZ at foo SNR," it should not magically improve as a function of the oversample. The problem isn't that awgn() generates white noise, that's what it's supposed to do and the typical receiver has noise across the entire band. The problem is that SNR is most properly defined as the signal power over the noise power spectral density times the signal's noise equivalent bandwidth. Now I looked and there's no handy function for computing NEBW for an input signal (there's just a function for assessing analysis windows). In practice it can get a bit tricky. The occupied bandwidth or HPBW are often close enough to the NEBW, we're usually not haggling over hundredths of a dB. So, in my not so humble opinion, the "measured" flag for awgn() should give an option for bandwidth matching or at least document the behavior better in the help page. All too often I'm seeing 3-6 (or worse) dB errors because people aren't taking the signal's bandwidth into account.
Hello,
i want to write the power data from my Tasmota IR Device to my channels, but it does not work.
I have created 3 channels and i use the correct write API in the script. I use the following script:
>D
>B
=>sensor53 r
>S
if upsecs%20==0
then
=>WebSend [api.thingspeak.com] /update.json? api_key=xxxxxxxxxxxxxxxx&field1=%sml[1]%&field2=%sml[2]%&field3=%sml[3]%
endif
>M 1
+1,3,s,0,9600,
1,77070100010800ff@1000,Total consumption,kWh,total_in,2
1,77070100020800ff@1000,Total feed-in,kWh,total_out,2
1,77070100100700ff@1,Power,W,power_curr,0
#
I get the messages in the console that the data was send but my channels stay empty.
What do i miss ?
Thanks for help
I am collecting Data at 1 minute intervals using esp8266, the data is then sent to Thingspeak on the minute intervals. However I would like to store the data collection on the esp Ram. I am using batteries to power the circuits , if I can store the data and send it on demand I can save quite a bit of battery energy (used up by wifi) - (I already use sleep mode between intervals). As well as using Thingspeak to visuliase the data, I also use a third part app called Thingview which 'feeds' off thingspeak. I am looking for a way to trigger the 'data send' upon opening thinkspeak chanel,so rather than sending every minute it might need to be accessed two or three times a day, is this possible?
Thanks Edward
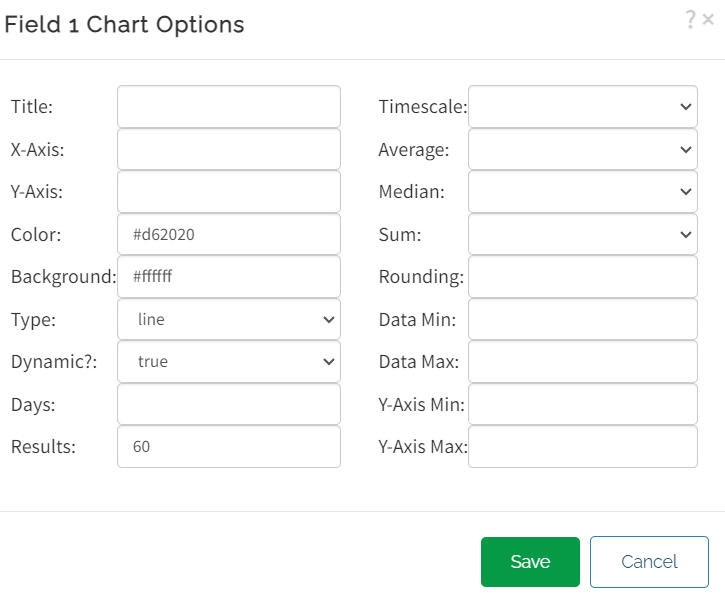
Hi!
I can't see my data in the charts. I'm using arduino wifi and the connection works.
Maybe I did something wrong in this options
Is there a way to get a handle or link to the database each time I do a WRITE or group of WRITEs? I need to access the set of records that comprises a user session, which could be many WRITEs. My impression is that Thingspeak appears as a continuous stream with no way to mark a set of WRITEs as a group or session. Methods I have tried like retrieval (READs) using timestamps and other after-the-fact queries are not very accurate or user friendly. Thanks.
You are invited to join our 2023 community contest – MATLAB Flipbook Mini Hack! This year’s contest revolves around creating interesting animations using MATLAB.
Whether you are a seasoned MATLAB user or just getting started, this contest offers a fantastic opportunity to showcase your skills, learn from others, and engage with the vibrant MATLAB Central community.
Timeframe
This contest runs for 4 weeks from Nov. 6th to Dec. 3rd.
How to play
- Create a new animation or remix an existing one with up to 2,000 characters of code.
- Simply vote on the animations you love!
Prizes
You will have opportunities to win compelling prizes, including Amazon gift cards, MathWorks T-shirts, and virtual badges. We will give out both weekly prizes and grand prizes.


The MATLAB Central Community team
Here's a MATLAB class I wrote that leverages the MATLAB Central Interface for MATLAB toolbox, which in turn uses the publicy available Community API. Using this class, I've created a few Favorites that show me what's going on in MATLAB Central - without having to leave MATLAB 🙂
The class has a few convenient queries:
- Results for the last 7 days
- Results for the last 30 days
- Results for the current month
- Results for today
And supporting a bunch of different content scopes:
- All MATLAB Central
- MATLAB Answers
- Blogs
- Cody
- Contests
- File Exchange
- Exclude Answers content
The results are displayed in the command window (which worked best for me) and link to each post. Here's what that looks like for this command
>> CommunityFeed.thisMonth("app designer", CommunityFeed.Scope.ExcludeAnswers)
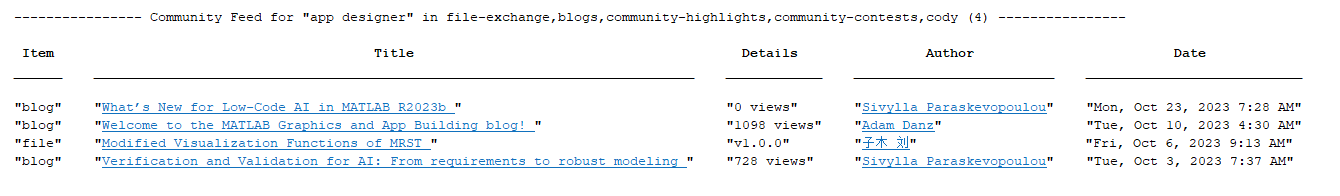
Let me know if you find this class useful and feel free to suggest changes.
we are planning to design a drive for an EV using synchronous reluctance motor. To move further we need some drive circuits for simulating and comparing various motors with synchronous reluctance to justify our literature survey. can we get som circuit suggestions?
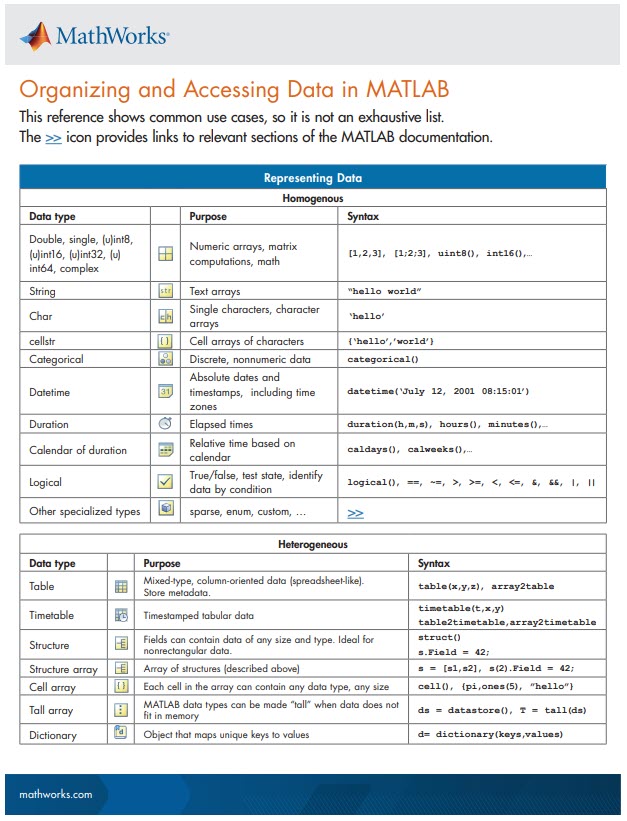
New Cheat Sheet Alert!
Level up your data organization and access skills in MATLAB with our latest cheat sheet! Download the full cheat sheet on MATLAB GitHub for Students here.
I rarely/never save .fig files
47%
Continue working on it later
16%
Archive for future reference
23%
Share within my organization
10%
Share outside my organization
2%
Other (please leave a comment)
2%
2097 votes
I know the latest version of MATLAB R2023b has this feature already, put it should be added to R2023a as well because of its simplicity and convenience.
Basically, I want to make a bar graph that lets me name each column in a basic bar graph:
y=[100 99 100 200 200 300 500 800 1000];
x=["0-4" "5-17" "18-29" "30-39" "40-49" "50-64" "65-74" "75-84" "85+"];
bar(x,y)
However, in R2023a, this isn't a feature. I think it should be added because it helps to present data and ideas more clearly and professionally, which is the purpose of a graph to begin with.
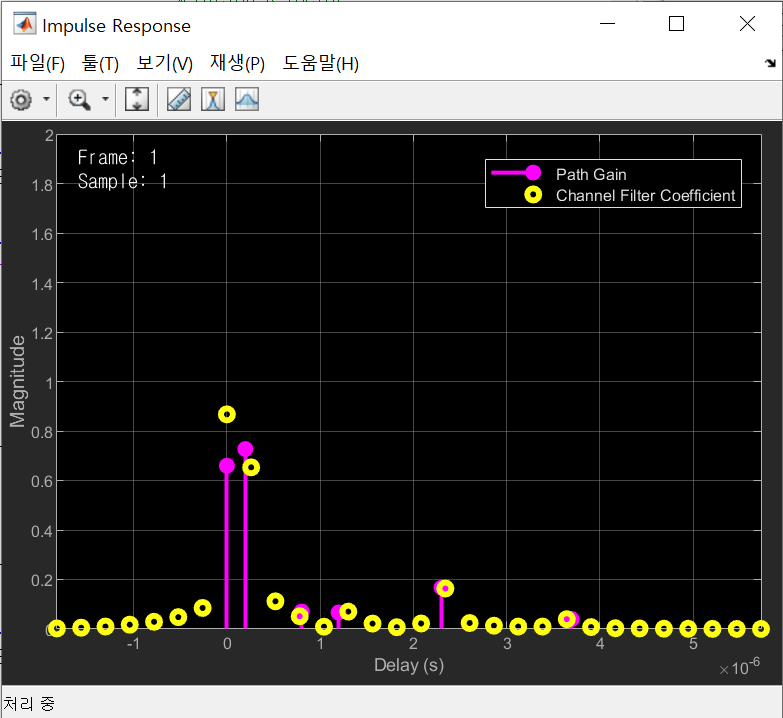
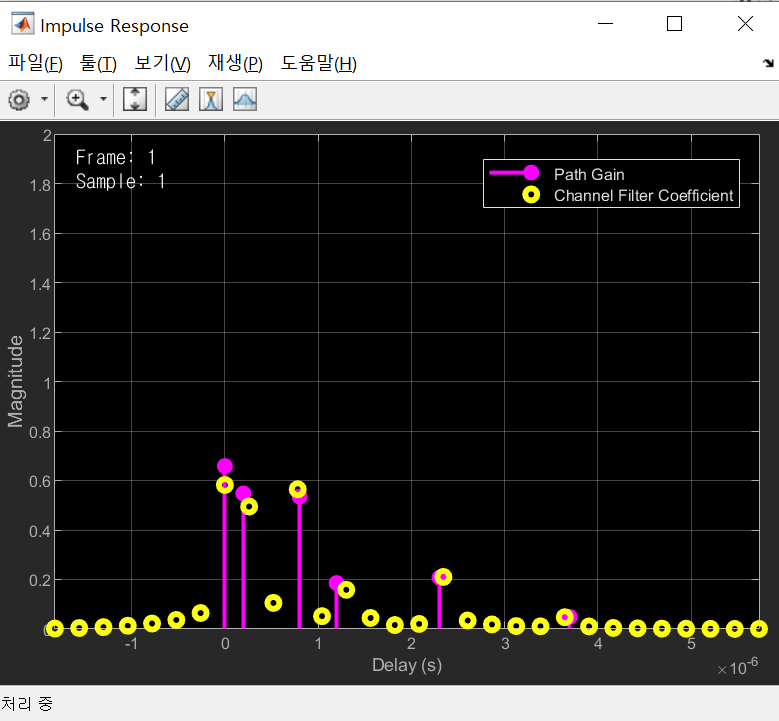
I am running the code from the following URL: https://kr.mathworks.com/help/comm/ref/comm.ricianchannel-system-object.html. I copied and executed the example to visualize the channel's impulse response. However, when I run the same code multiple times with the same path gains and delays, I get different impulse response results each time. What could be the reason for this?
This behavior is unexpected because the code and settings are the same for each run, and the impulse response should remain constant.
This is the code.
fs = 3.84e6; % Sample rate in Hz
pathDelays = [0 200 800 1200 2300 3700]*1e-9; % in seconds
avgPathGains = [0 -0.9 -4.9 -8 -7.8 -23.9]; % dB
kfact = 10; % Rician K-factor
fD = 50; % Max Doppler shift in Hz
ricianChan = comm.RicianChannel( ...
SampleRate=fs, ...
PathDelays=pathDelays, ...
AveragePathGains=avgPathGains, ...
KFactor=kfact, ...
MaximumDopplerShift=fD, ....
Visualization='Impulse and frequency responses');
ricianChan(0.1);
The two images below show the results of running the same code.
Hi,
I was wondering if anyone could help me with how I can simplify this part of my script, specifically scenario 1-3, so that it is easier to read. Perhaps with functions etc. (the comments are in swedish sorry heh. But the script works).
Thanks in advance!
F1_batt_till_P19 = zeros(8760,length(Effekt)); % det som batteriet laddar upp fastigheten med
F1_Elkons_batt = zeros(8760,length(Effekt)); % konsumtionen från nätet av batteriet
F1_batterilast_tot = zeros(8760,length(Effekt)); % batterilasten lagras kontenueligt.
F1_elkonsum = [];
for k = 1: length(Effekt) % går igenom alla olika effekter mellan 100 - 1000 kW
F1_last_batt = 0; % batteriet måste nollas efter varje ny effekt.
batterikapacitet = Kapacitet(k); % såhär stort är batteriet beroende på effekten. Beror på C rate (blir dubbelt så stort som effekten).
batterikapacitet_min = batterikapacitet * SOC_low/100; % undre gräns
batterikapacitet_max = batterikapacitet *SOC_high/100; % övre gräns
F1_last_batt = batterikapacitet_min; % hur mycket kapacitet har batteriet. Finns det något . Börjar tomt.
for i = 1:12 % gå igenom månaderna
mon = [31,28,31,30,31,30,31,31,30,31,30,31];
slut = mon(i)*24;
% medelkonsumtionen (i kW) per månad Elkons_months_eft(744,12)
medel_kons = mean(Elkons_months_eft(1:slut, i)); % Månadens medelkonsumtion
for m = 1:slut % gå igenom timmarna per månad
% går igenom varje timme (m), för varje månad (i).
% scenario 1 - batteriet laddar ur till medelvärdet
if Elkons_months_eft(m,i) > medel_kons
topp = Elkons_months_eft(m,i) - medel_kons; % storleken på toppen över medelvärde
% Om batteriet inte är tomt från början. Om det kan laddas ur.
if F1_last_batt > batterikapacitet_min
% Om batteriet kan laddas ur med hela efffekten utan att gå under min
if (F1_last_batt - Effekt(k)) >= batterikapacitet_min
% Om toppen är större eller lika med än vad som får kapas med batteriet - hela effekten används.
if topp >= Effekt(k) % A
F1_batt_till_P19( (24*sum(mon(1:i-1)) + m) ,k) = Effekt(k); % effekt under timmen som batteriet tillgodoser till Pyramiden 19
F1_last_batt = F1_last_batt - Effekt(k); % batteriet laddas ur med hela effekten den timmen
% Om toppen inte är större än effekten - hela toppen kapas.
else % B
F1_batt_till_P19((24*sum(mon(1:i-1)) + m) ,k) = topp;
F1_last_batt = F1_last_batt - topp;
end
% Om batteriet inte kan tömmas med hela effekten.
else
liten_effekt = F1_last_batt - batterikapacitet_min; % mängden som kan laddas ur.
% Om toppen är större än det vi kan använda – allt som är kvar används
if topp >= liten_effekt % C
F1_batt_till_P19((24*sum(mon(1:i-1)) + m) , k) = liten_effekt; % effekt under timmen som batteriet tillgodoser till Pyramiden 19
F1_last_batt = F1_last_batt - liten_effekt; % batteriet laddas ur till min
% Om toppen inte är större än det vi kan använda - hela toppen kapas
else % D
F1_batt_till_P19( (24*sum(mon(1:i-1)) + m) ,k) = topp;
F1_last_batt = F1_last_batt - topp;
end
end
end
% scenario 2 - batteriet laddar upp och tar från nätet
elseif Elkons_months_eft(m,i) < medel_kons
% Om batteriet inte är fullt
if F1_last_batt < batterikapacitet_max
% Om det får plats en laddning av hela effekten – Batteriet laddas upp
if (F1_last_batt + Effekt(k)) <= batterikapacitet_max
% Om uppladdningen inte överstiger medelvärdet – Batteriet laddas upp med effekten
if (Elkons_months_eft(m,i) + Effekt(k)) <= medel_kons % A
F1_Elkons_batt((24*sum(mon(1:i-1)) + m),k) = Effekt(k); % mängden som tas från nätet
F1_last_batt = F1_last_batt + Effekt(k);
% Om uppladdningen överstiger medelvärdet – Batteriet laddas upp med det som går
else % B
till_medel = medel_kons - Elkons_months_eft(m,i);
F1_Elkons_batt((24*sum(mon(1:i-1)) + m),k) = till_medel;
F1_last_batt = F1_last_batt + till_medel;
end
% Om det får plats mindre än hela efffekten i en laddning – Batteriet laddas fullt
else
plats = batterikapacitet_max - F1_last_batt; % det som får plats i batteriet
% Om elkonsumtionen ej överstiger medelvärdet – Batteriet laddas upp till max-taket
if (Elkons_months_eft(m,i) + plats) <= medel_kons % C
F1_Elkons_batt((24*sum(mon(1:i-1)) + m),k) = plats;
F1_last_batt = F1_last_batt + plats;
% Om elkonsumtionen överstiger medelvärdet – Batteriet laddas upp med det som går
else % D
till_medel = medel_kons - Elkons_months_eft(m,i);
F1_Elkons_batt((24*sum(mon(1:i-1)) + m),k) = till_medel;
F1_last_batt = F1_last_batt + till_medel;
end
end
end
% scenario 3 - om inget händer
elseif Elkons_months_eft(m,i) == medel_kons
% inget händer. Precis som jag vill ha det.
end
F1_batterilast_tot((24*sum(mon(1:i-1)) + m),k) = F1_last_batt; % lägger in batterilasten för timmen i en lista.
end % slut - for timmar per mån (m)
end %slut for - månaderna (i)
% tar bort den sista uppladdningen av batteriet så det kommer ner till min värdet iaf
% får ta bort min värdet kostnaden sen manuellt.
for p = 0:(8760-1)
% Om batteriet har laddning över min kvar i slutet
if F1_last_batt > batterikapacitet_min
over = F1_last_batt - batterikapacitet_min;
% Om platsen är större än eller lika med laddningen på batteriet – Batteriet töms ner till min
if F1_Elkons_batt(end-p,k) >= over
F1_Elkons_batt(end-p,k) = F1_Elkons_batt(end-p,k) - over;
F1_last_batt = batterikapacitet_min;
F1_batterilast_tot(end-p,k) = batterikapacitet_min;
% Om platsen är mindre än laddningen på batteriet – Batteriet töms med hela platsen
elseif F1_Elkons_batt(end-p,k) < over
F1_last_batt = F1_last_batt - F1_Elkons_batt(end-p,k);
F1_batterilast_tot(end-p,k) = batterikapacitet_min;
F1_Elkons_batt(end-p,k) = 0;
end
end
end
end % slut for - effekt (k)
% summerar ihop året till ett värde. Får ett värde för varje effekt.
F1_elkonsum_sum =[];
F1_batt_till_P19_sum =[];
F1_Elkons_batt_sum = [];
F1_effekttopp_medel_year = []; % medel effekttopp under året
for v = 1:length(Effekt)
F1_elkonsum(:,v) = (Elkonsumtion_eft(:,1) - F1_batt_till_P19(:,v)) + F1_Elkons_batt(:,v); % elnätskonsumtion under året
F1_elkonsum_sum(v) = sum(F1_elkonsum(:,v));
F1_batt_till_P19_sum(v) = sum(F1_batt_till_P19(:,v));
F1_Elkons_batt_sum(v) = sum(F1_Elkons_batt(:,v));
end
% figure; yyaxis right; plot(F1_elkonsum(:,20));
% hold on; plot(Elkonsumtion_eft(:,1));
% hold on; yyaxis left; plot(F1_batterilast_tot(:,20)); legend('Konsum','ladd');
% Beräknar maxeffekten (toppen) för varje månad för alla effekter. Blir en 12 x length(effekt) lista
% Den går per rad och tar maxeffekten för månaden för alla kolumner = för alla olika effekter.
F1_effekttopp_months = zeros(12,length(Effekt)); % effekttopp under månaden för alla olika effekter.
mon = [31, 28, 31, 30, 31, 30, 31, 31, 30, 31, 30, 31];
for b = 1:12
F1_effekttopp_months(b,:) = max(F1_elkonsum( (24*sum(mon(1:b-1)) + 1) : 24*sum(mon(1:b)) , : ) ); % [kW]
end
% beräknar medeleffekten för året
for v = 1:length(Effekt)
F1_effekttopp_medel_year(v) = mean(F1_effekttopp_months(:,v));
end