plotSensorData
R2026bDescription
plotSensorData(
plots the sensor data on the tracking globe viewer using the sensor specifications specified
by viewer,sensorData,sensorSpecs)sensorSpecifications.
plotSensorData(___,
specifies options using one or more name-value arguments. For example,
Name=Value)plotSensorData(viewer,radarData,radarSpecs,Color=[1 0 0]) specifies the
color of the plotted detections as the RGB triplet [1 0 0].
Examples
Create a tracking globe viewer and specify its reference location and camera position.
refloc = [42.39423231362 -70.95934958874 0];
mapViewer = trackingGlobeViewer('ReferenceLocation',refloc,'Basemap','streets-dark');
campos(mapViewer,refloc + [0 0 1e5]);
Load the sensor data and specifications for a monostatic radar and an ESM radar.
load("sensorDataFromTwoSensors.mat");Plot detections for both radars and specify the color for the detections from each sensor. Take a snapshot to show the results.
plotSensorData(mapViewer, {radar1Data,radar2Data}, ...
    {radar1Spec,radar2Spec},Color=[1 0 0; 0 1 0])
drawnow
pause(20)
snapshot(mapViewer)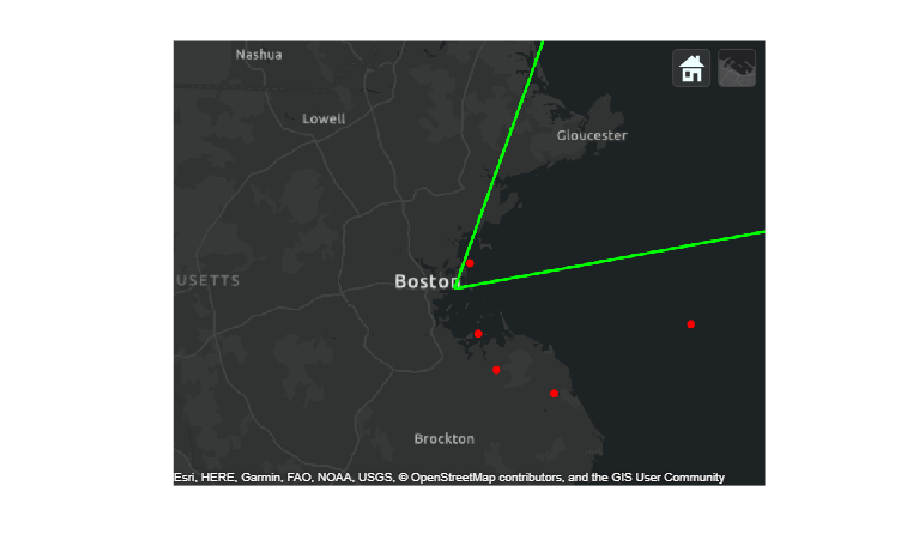
Additionally, you can plot the coverage of the radars using the plotCoverage function.
plotCoverage(mapViewer, {radar1Data,radar2Data}, ...
    {radar1Spec,radar2Spec},Color=[1 0 0; 0 1 0],Alpha=0.1)
drawnow
snapshot(mapViewer)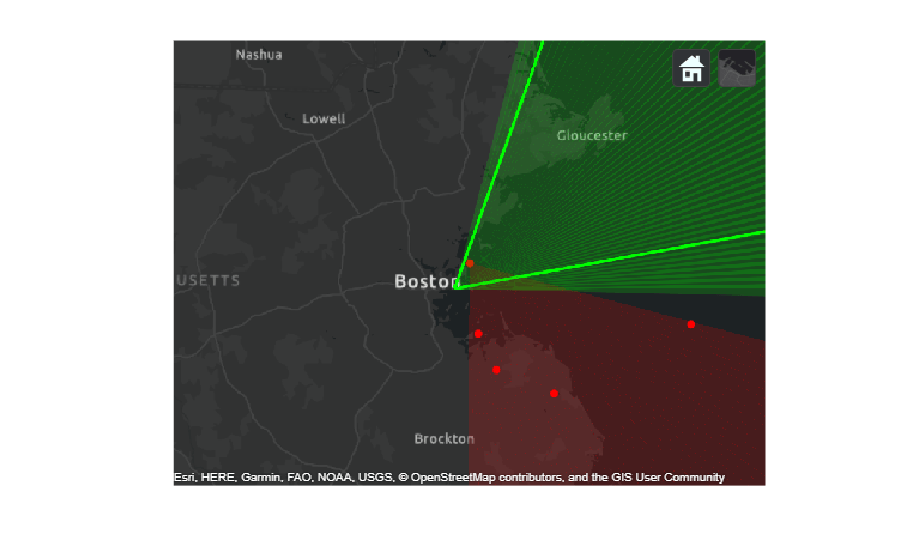
Input Arguments
Name-Value Arguments
Version History
Introduced in R2026b
See Also
trackingGlobeViewer | trackerSensorSpec | plotScenario | plotPlatform | plotDetection | plotTrajectory | plotCoverage | plotTrack | clear | snapshot | campos | camorient
1 Alignment of boundaries and region labels are a presentation of the feature provided by the data vendors and do not imply endorsement by MathWorks®.

