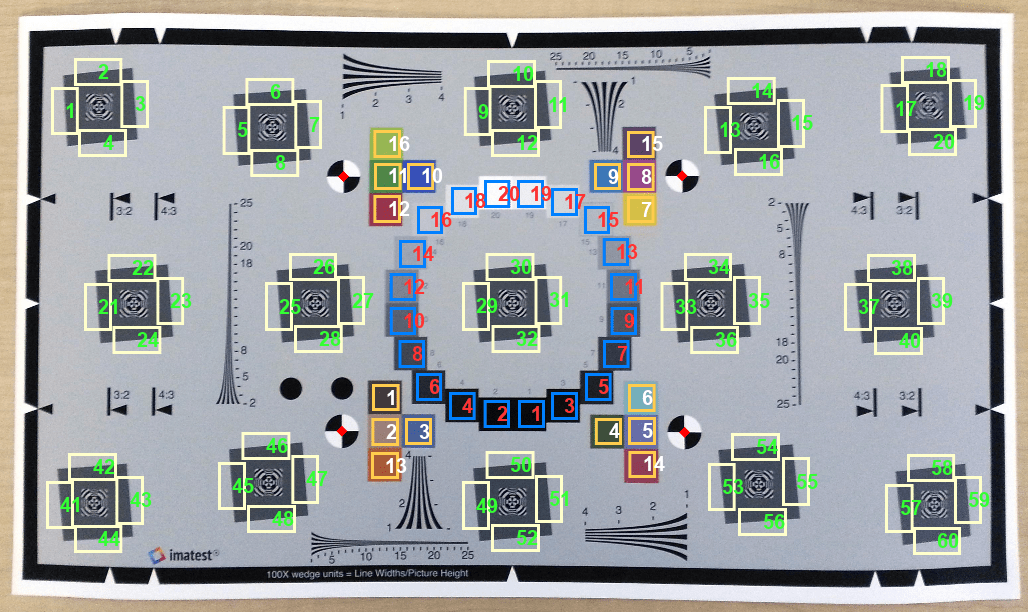
esfrChart
Imatest edge spatial frequency response (eSFR) test chart
Description
An esfrChart object stores the positions and measurements of
regions of interest (ROIs) of Imatest® edge spatial frequency response (eSFR) test charts [1], [2].
The esfrChart object supports the Enhanced and Extended versions of
the eSFR test chart. These test charts are based on the ISO 12233:2014 standard test
chart, and they have extra visual features such as color ROIs and additional slanted
edge ROIs. The esfrChart object also accepts versions of the Enhanced
and Extended eSFR test charts with additional background wedges.
Creation
Syntax
Description
chart = esfrChart( creates an
A)esfrChart object from an image of a test chart,
A. The esfrChart object performs
automatic detection of the chart position and style.
chart = esfrChart(A,"RegistrationPoints",
creates an p)esfrChart object by specifying the position,
p, of registration points.
chart = esfrChart(___,
refines the automatic chart detection using one or more name-value
arguments.Name=Value)
Input Arguments
Name-Value Arguments
Properties
Object Functions
measureSharpness | Measure spatial frequency response using test chart |
measureChromaticAberration | Measure chromatic aberration at slanted edges |
measureNoise | Measure noise of test chart |
measureColor | Measure color reproduction using test chart |
measureIlluminant | Measure scene illuminant using test chart |
displayChart | Display test chart with overlaid regions of interest |
Examples
Tips
For accurate and reliable results, acquire an image of the test chart according to standard specifications outlined in the ISO standard and by the manufacturer [2], [3]. As a simple guideline, align the chart horizontally on a light background. Cover over 90% of the field of view with the chart, but ensure that the top and bottom edges of the chart are still visible. For reliable measurements, set the minimum image width to at least 500 pixels.
You can capture an image of the Extended eSFR test chart at the full 16:9 aspect ratio, or at an aspect ratio of 3:2 or 4:3, as specified on the chart.
To ensure that the chart is properly imported, visually verify the test chart image using the
displayChartfunction.The size and position of the estimated ROIs can vary slightly depending on your operating system and machine hardware.
References
[1] Imatest. "Esfr". https://www.imatest.com/mathworks/esfr/.
[2] Using eSFR ISO Part 1. URL: https://www.imatest.com/docs/esfriso_instructions.
[3]

