montage
Display multiple images as rectangular montage
Syntax
Description
montage( displays a montage of
images specified by imagelist)imagelist. The images can be of different
types and sizes. By default, the montage function arranges the
images so that they roughly form a square.
montage(___, treats all
grayscale and binary images (specified using any of the preceding syntaxes) as
indexed images and displays them with the specified colormap
map)map. If you specify images using filenames or an image
datastore, then map overrides any internal colormap present in
the image files. montage does not modify the colormap of RGB
images.
montage(___, uses
name-value arguments to customize the display of the image montage.Name=Value)
img = montage(___)
Note
Medical Imaging Toolbox™ extends the functionality of the montage
(Image Processing Toolbox™) function to display data from a medicalImage (Medical Imaging Toolbox) or medicalVolume (Medical Imaging Toolbox) object. For more information, see montage (Medical Imaging Toolbox).
Examples
Read several images of different types and sizes into the workspace.
imRGB = imread("peppers.png");
imGray = imread("coins.png");
Display a montage containing all of the images.
figure
montage({imRGB,imGray,"cameraman.tif"})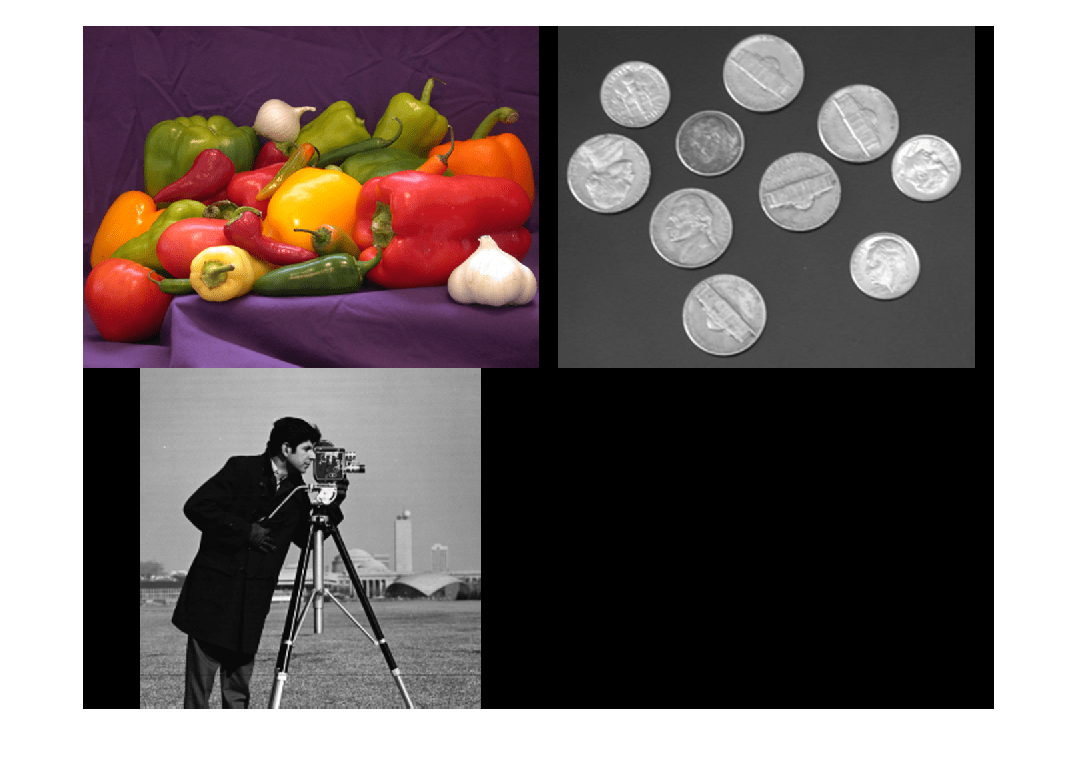
Create an ImageDatastore object containing a series of ten images from the Image Processing Toolbox™ sample image folder.
fileFolder = fullfile(matlabroot,"toolbox","images","imdata");
imds = imageDatastore(fullfile(fileFolder,"AT3*"));
Display the contents of the datastore as a montage.
montage(imds)

Load an MRI dataset.
load mristackDisplay the dataset. montage treats the data as a multiframe image and displays each slice.
montage(mristack)

Create a montage from a series of images in files. Make the montage a 2-by-5 rectangle. Then, create a second montage, this time using the "DisplayRange" name-value argument to highlight structures in the image.
Display the Images as a Rectangular Montage
Create a string array containing a series of file names.
fileFolder = fullfile(matlabroot,"toolbox","images","imdata");
dirOutput = dir(fullfile(fileFolder,"AT3_1m4_*.tif"));
fileNames = string({dirOutput.name});
Display the images as a montage. Specify the shape of the montage as a 2-by-5 rectangle.
montage(fileNames,"Size",[2 5]);
Adjust the Contrast of the Images in the Montage
In another figure, create the same 2-by-5 montage. In addition, specify the display range to adjust the contrast of the images in the montage.
figure
montage(fileNames,"Size",[2 5],"DisplayRange",[75 200]);

View all the images in a MRI data set using montage with default settings. There are 27 images in the set.
load mri
montage(D,map)
Create a new montage containing only the first 9 images.
figure
montage(D,map,Indices=1:9);

Input Arguments
Name-Value Arguments
Specify optional pairs of arguments as
Name1=Value1,...,NameN=ValueN, where Name is
the argument name and Value is the corresponding value.
Name-value arguments must appear after other arguments, but the order of the
pairs does not matter.
Example: montage(I,Indices=1:9) creates a montage of the first
nine frames of multiframe image I.
Before R2021a, use commas to separate each name and value, and enclose
Name in quotes.
Example: montage(I,"Indices",1:9)
Background color, specified as specified as an RGB triplet, a
hexadecimal color code, a color name, or a short color name. The
montage function fills all blank spaces with
the background color, including the space specified by
BorderSize. If you specify a background color,
then the montage function renders the output as an
RGB image.
For a custom color, specify an RGB triplet or a hexadecimal color code.
An RGB triplet is a three-element row vector whose elements specify the intensities of the red, green, and blue components of the color. The intensities must be in the range
[0,1], for example,[0.4 0.6 0.7].A hexadecimal color code is a string scalar or character vector that starts with a hash symbol (
#) followed by three or six hexadecimal digits, which can range from0toF. The values are not case sensitive. Therefore, the color codes"#FF8800","#ff8800","#F80", and"#f80"are equivalent.
Alternatively, you can specify some common colors by name. This table lists the named color options, the equivalent RGB triplets, and the hexadecimal color codes.
| Color Name | Short Name | RGB Triplet | Hexadecimal Color Code | Appearance |
|---|---|---|---|---|
"red" | "r" | [1 0 0] | "#FF0000" |
|
"green" | "g" | [0 1 0] | "#00FF00" |
|
"blue" | "b" | [0 0 1] | "#0000FF" |
|
"cyan"
| "c" | [0 1 1] | "#00FFFF" |
|
"magenta" | "m" | [1 0 1] | "#FF00FF" |
|
"yellow" | "y" | [1 1 0] | "#FFFF00" |
|
"black" | "k" | [0 0 0] | "#000000" |
|
"white" | "w" | [1 1 1] | "#FFFFFF" |
|
This table lists the default color palettes for plots in the light and dark themes.
| Palette | Palette Colors |
|---|---|
Before R2025a: Most plots use these colors by default. |
|
|
|
You can get the RGB triplets and hexadecimal color codes for these palettes using the
orderedcolors
and rgb2hex
functions. For example, get the RGB triplets for the "gem" palette and
convert them to hexadecimal color
codes.
RGB = orderedcolors("gem");
H = rgb2hex(RGB);
Before R2023b: Get the RGB triplets using RGB =
get(groot,"FactoryAxesColorOrder").
Example: BackgroundColor="r"
Example: BackgroundColor="green"
Example: BackgroundColor=[0 0.4470
0.7410]
Example: BackgroundColor="#00FFFF"
Padding around each thumbnail image, in pixels, specified as a
nonnegative integer or a 1-by-2 vector of nonnegative integers. The
montage function pads the image borders with
the background color, BackgroundColor.
Data Types: single | double | int8 | int16 | int32 | int64 | uint8 | uint16 | uint32 | uint64
Display range of grayscale images, specified as 1-by-2 vector of the
form [low
high]. All pixel values less than or
equal to low display as black. All pixel values
greater than or equal to high display as white. If
you specify an empty matrix ([]), then
montage uses the minimum and maximum pixel
values of the images. If any of the images are color images, then the
montage function ignores this argument for all
images.
Data Types: single | double | int8 | int16 | int32 | int64 | uint8 | uint16 | uint32 | uint64
Frames to display in the montage, specified as an array of positive
integers. The montage function interprets the
values as indices into the set of images specified by
imagelist, imds, or
I.
By default, the montage function displays all
image files or frames.
Example: Indices=1:4 create a montage of the first
four frames in I
Example: Indices=1:2:20 displays every other frame
of the first twenty frames.
Data Types: single | double | int8 | int16 | int32 | int64 | uint8 | uint16 | uint32 | uint64
Interpolation technique used to resize the montage for display, specified as one of these values.
| Value | Description |
|---|---|
"nearest" | Nearest neighbor interpolation (default) |
"bilinear" | Bilinear interpolation |
Parent of the image object created by montage,
specified as an axes object. The montage function
resizes the image to fit the extents available in the parent
axes.
Number of rows and columns of images, specified as a 2-element vector
of the form [nrows ncols].
If you specify NaN or Inf for a
particular dimension, then the montage function
calculates the value of the dimension to display all images in the
montage. For example, if Size is [2
NaN], then the montage will have two rows and the minimum
number of columns to display all images. When there is a mismatch
between Size and number of images (frames) specified,
then the montage function creates the tiled image
based on Size.
Data Types: single | double
Interpolation method to resize images for thumbnails, specified as one of these values.
| Method | Description |
|---|---|
| Nearest-neighbor interpolation, performed using a box-shaped interpolation kernel. The output pixel is assigned the value of the pixel that the point falls within. No other pixels are considered. |
| Bilinear interpolation, performed using a triangular interpolation kernel. The output pixel value is a weighted average of pixels in the nearest 2-by-2 neighborhood. |
| Bicubic interpolation, performed using a piecewise cubic interpolation kernel. The output pixel value is a weighted average of pixels in the nearest 4-by-4 neighborhood. Note Bicubic interpolation can produce pixel values outside the original range. |
"lanczos2" | Interpolation using a Lanczos-2 kernel. |
"lanczos3" | Interpolation using a Lanczos-3 kernel. |
The default resizing method, "bicubic", typically
works well when the images are larger than the thumbnails. If the size
of your images is smaller than the thumbnails and you want to avoid
smoothing the pixel values, then consider setting
ThumbnailInterpolation as
"nearest".
Data Types: char | string
Size of each thumbnail, in pixels, specified as a 2-element vector of
positive integers. The aspect ratio of each image is preserved, and any
blank space is filled with the background color,
BackgroundColor.
If you specify an empty array ([]), then the
thumbnail size is the full size of the first image. If you specify
either element as NaN or Inf, then
the montage function calculates the corresponding
value automatically to preserve the aspect ratio of the first
image.
Data Types: single | double
Output Arguments
Tips
If you specify an indexed image, then
montageconverts it to RGB using the colormap present in the file.If there is a data type mismatch between images, then the
montagefunction converts all images to data typedoubleusing theim2doublefunction.When calculating the number of images to display horizontally and vertically,
montageconsiders the aspect ratio of the images, so that the displayed montage is nearly square.When you display a montage in the Live Editor, the figure is embedded in the live script output. To open the figure in a separate window, click the Open in figure window button
 in the upper-right corner of the
output.
in the upper-right corner of the
output.Figure titles can appear cut off in the Live Editor. To ensure the whole title is visible, set the
PositionContraintproperty of the parent axes object to"outerposition". Update the property value after themontagefunction and before thetitlefunction.If you specify the parent axes using theI = imread("peppers.png"); montage({I,I}) ax = gca; ax.PositionConstraint = "outerposition"; title("Peppers");
Parentname-value argument, set thePositionConstraintproperty of the specified parent axes object. For more details about axes position properties, see Control Axes Layout.