bubblelim
Map bubble sizes to data range
Syntax
Description
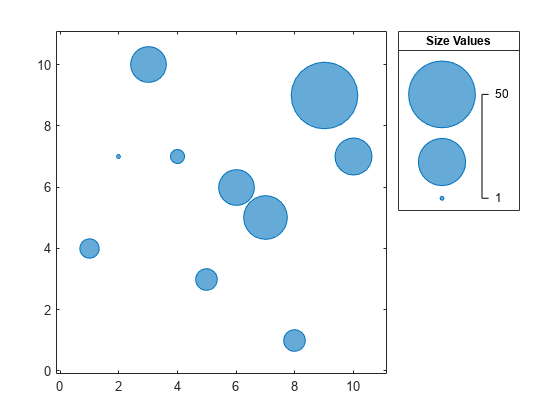
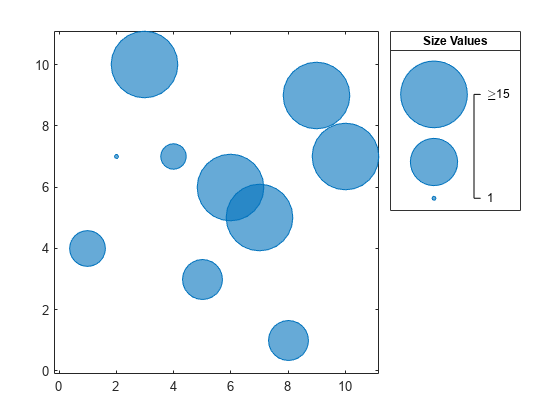
bubblelim( sets the bubble size limits
for the current axes. Specify limits as a two-element vector of the form limits)[bmin
bmax], where bmax is greater than bmin.
When you set the limits, the smallest bubble in the axes corresponds to
bmin, and the largest bubble corresponds to bmax.
For example, bubblelim([10 50]) maps the smallest and largest bubbles to
the data values 10 and 50 respectively.
lim = bubblelim returns the bubble limits of the current axes as a
two-element vector.
bubblelim( enables either automatic
or manual mode for setting the limits. Specify modevalue)modevalue as
'auto' to let MATLAB® set the limits according to the range of your plotted data. Specify
'manual' to hold the limits at the current value.
mv = bubblelim('mode') returns the current bubble limits mode
value, which is either 'auto' or 'manual'. By default,
the mode value is 'auto' unless you specify limits or set the mode value
to 'manual'.
___ = bubblelim(
sets the limits in the specified axes instead of the current axes. Specify
ax,___)ax before all other input arguments in any of the previous syntaxes.
You can include an output argument if the original syntax supports an output argument. For
example, lim = bubblelim(ax) returns the limits for the axes
ax.
Examples
Input Arguments
Version History
Introduced in R2020b


