Create Custom Features in Diagnostic Feature Designer
Diagnostic Feature Designer provides a set of built-in processing functions that allow you to extract features from your ensemble data. You can also add additional functions to extract custom features and work with these features just as you would with any other features in the app. For example, your custom feature processing might include:
Existing command-line functions that the app does not incorporate, such as
meanfreqSpecialized functions that combine a number of operations
The one requirement is that the custom feature syntax follows the following form.
function Feature = myCustomFunction(DataVariable,IndependentVariable,varargin)Vibration
that contains a data variable and a time variable, the custom function uses these two
variables as the first two input arguments. You can specify additional arguments in
varargin to support the processing or to select specific outputs.To use Custom Features, perform the following general steps:
Select a variable, such as a signal or a spectrum, in the Variables pane.
Select either Time-Domain Features > Custom Features or Frequency-Domain Features > Custom Features.
In the Custom Features tab, click Add Function.
In Create New Function, provide the name you want for the new function. The app brings up a template for you to create it. If the function already exists, provide that in Add Function.
Use Check Function to test your function on the first member of your ensemble.
Set Plot to select whether to automatically plot histograms when you apply the function.
Click Apply.
The app adds the custom features to the feature table alongside built-in features that you compute and includes them when performing feature ranking and when exporting features to Classification Learner or to your MATLAB® workspace.
General Workflow Description
Add Custom Function
Start by selecting a signal or spectrum from the Variables pane. Then, select either Time-Domain Features > Custom Features or Frequency-Domain Features > Custom Features. In the following figure, the Vibration signal is selected, so the available Custom Features option is in Time-Domain Features.
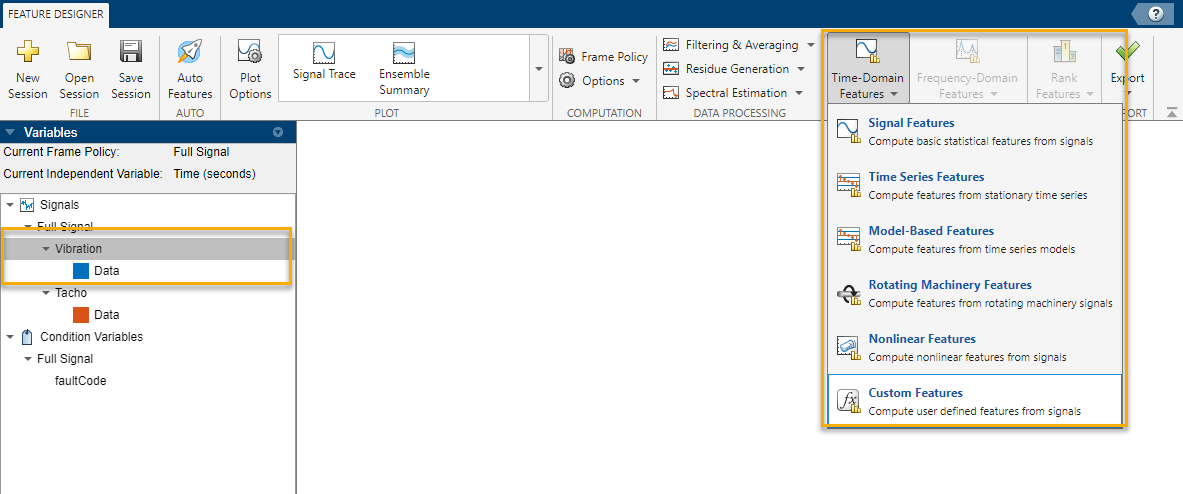
The Custom Features tab includes the operations for adding a function, checking the function, and, finally, applying the function and creating the new features.

Select Plot Results if you want the app to automatically plot
histograms once you have applied the function. To initiate the process of adding a
function, click Add Function. The app then brings up a dialog box
that lets you start the process of creating a function by specifying a name. You can also
add an existing function if that function already exists on your path. In the following
figure, a new function named customZeroCrossings will be created.

Clicking OK creates a new template script.
function Feature = CustomZeroCrossings(DataVariable,IndependentVariable,varargin)
% Input:
% DataVariable: Selected Signal
% IndependentVariable: The current independent variable associated with the selected signal
% varargin: The additional input arguments to the function
% Output:
% Feature: A numeric scalar or vector value
Feature = [];    %Assign the computed feature value here
end
All custom functions use the same basic argument list: the data variable (for example,
Vibration/Data), the independent variable (for example,
Vibration/Time), and any additional optional arguments that the
function requires. For examples of typical custom functions, see Examples of Custom Feature Functions. Edit the script to
perform the custom feature processing that you want.
Test Custom Function
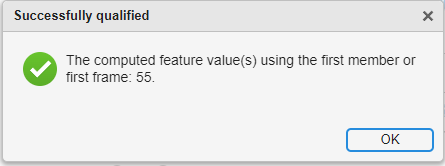
To qualify your new function, click Check Function. The app applies the processing only to the first member of your ensemble to verify that the feature can be computed without an error. If the function succeeds, the app shows a Successfully qualified message that contains the feature value for the first member or first frame. The app does not save this qualification value for any future use.
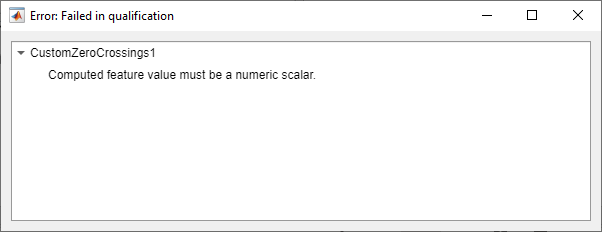
If the function fails, the app shows an error message.
Apply Custom Function
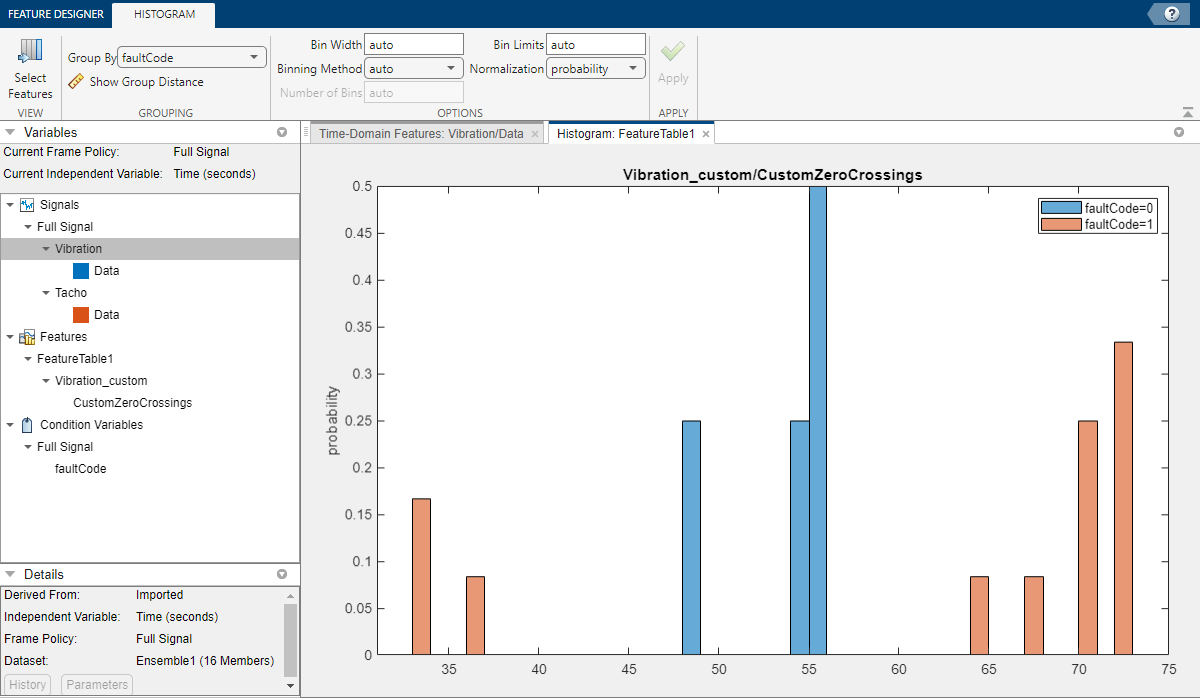
Once your function test is successful, you can click Apply to
generate your new feature and, if you have selected Plot, plot the
histogram. In the following figure, the new feature has been added to
FeatureTable1, and the histogram shows the distribution.
Use Custom Feature Table to Record Feature Information and Specify Arguments and Names
The app maintains a record of the custom functions you have added in a table that you can access by returning to the same Custom Feature tab that you used to create the feature. The table includes the function name, the optional arguments, the name of the feature that the app generates, and a description of the feature. You can modify any of the fields but the function name.
In Optional Arguments, you can provide additional information that your function requires such as a constant or method. You can also add multiple versions of the same function, but change the feature computation by specifying different argument values for the arguments for each field.
For the Generated Feature Name, you can specify the name that the app assigns to the feature.
In Description, you can capture any information that pertains to the custom function.
The following table illustrates a custom feature table with one entry. Select the row to perform operations such as editing the function script or deleting the function from the table. You can also create a new custom function from the feature table options. Select the check box to select the function for computation.

From the custom feature table, you can also select multiple functions to compute multiple features at once, add new features, edit features that are already in the table, and delete features from the table.

The custom feature table lets you specify arguments to pass to the function. In the
following figure, the custom function myCustomFunc computes the number
of zero crossings when the argument is Crossing and the number of sign
changes when the argument is Sign.The generated feature name is unique
for each argument specification.

The app stores custom signal features and custom spectral features in separate tables. To restore the time-domain Custom Feature tab and custom feature table, select any signal variable in the Variables pane and select Time-Domain Features > Custom Features. Similarly, for spectral features, select any spectrum variable and then select Time-Domain Features > Custom Features.
You can restore the feature table only during the session in which you create it. Saved sessions retain all the features you computed, but not the table itself.
Examples of Custom Feature Functions
Possible custom feature functions range from direct use of existing MATLAB functions to multipurpose functions that can provide a variety of feature types depending on what optional arguments you specify.
Use MATLAB Functions Directly
Some MATLAB functions already use the syntax that custom feature functions require. For
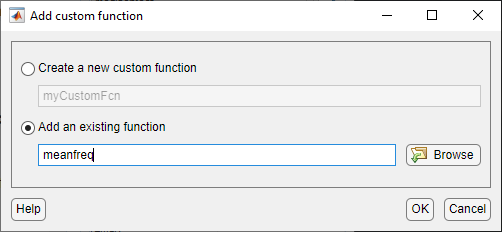
example, consider the function meanfreq in Signal Processing Toolbox™. This function uses the syntax freq = meanfreq(x,fs). In
this syntax, x is the spectral data variable and fs
is the independent variable. You can use this function to generate frequency-domain custom
features simply by typing meanfreq, as the following figure
shows.
Create Custom Features That Require Only Data Variables
Although the custom feature template includes arguments for both the data variable and
the independent variable, you can create functions that require just the data variable.
For example, the following code creates the feature
customZeroCrossings, which requires only signal data and not time.
Although the function syntax includes all arguments, the feature value calculation uses
only the signal data. This code excludes the template text comments, but you can choose
whether to include them in or exclude them from your
function.
function Feature = CustomZeroCrossings(DataVariable,IndependentVariable,varargin)
zcd = dsp.ZeroCrossingDetector;
Feature = double(zcd(DataVariable));    %Assign the computed feature here
end
Create Custom Features That Require Both Data Variables and Independent Variables
The following code example shows a more complex custom feature,
mySignChange, that uses both the signal values and the
time.
function Feature = mySignChange(DataVariable,IndependentVariable,varargin)
timeVector = time2num(IndependentVariable, "seconds");
dt = diff(timeVector);
dx = diff(DataVariable);
slope = dx./dt;
slope_sign = sign(slope);
Feature = numel(find(diff(slope_sign)));
end
Use Additional Arguments
You can use the optional arguments to provide special data constants or to select
processing options. In the following function, myCustomFunction, you
can compute either slope sign changes or zero crossings, depending on whether you set the
optional argument to Sign or Crossing.
function Feature = myCustomFunc(DataVariable,IndependentVariable,varargin)

% Extract underlying additional input from varargin
if ~isempty(varargin)
    FeatureType = varargin{:};CustomZeroCrossing1
    FeatureType = FeatureType{:};
end

% Compute feature based on the FeatureType that has been passed in as input
switch FeatureType
    case {'Sign','sign'}
        timeVector = time2num(IndependentVariable, "seconds");
        dt = diff(timeVector);
        dx = diff(DataVariable);
        slope = dx./dt;
        slope_sign = sign(slope);
        Feature = numel(find(diff(slope_sign)));
    case {'Crossing', 'crossing'}
        zcd = dsp.ZeroCrossingDetector;
        Feature = double(zcd(DataVariable));
end
end
To compute both types of feature from this code, add the feature to custom feature table twice, using the first argument for the first entry and the second argument for the second entry. Then select both and click Apply.