Main Content

filtfilt

Zero-phase digital filtering

Description

y = filtfilt(b,a,x) performs zero-phase digital filtering by processing the input data x in both the forward and reverse directions. After filtering the data in the forward direction, the function matches initial conditions to minimize startup and ending transients, reverses the filtered sequence, and runs the reversed sequence back through the filter. The result has these characteristics:

  • Zero phase distortion

  • A filter transfer function equal to the squared magnitude of the original filter transfer function

  • A filter order that is double the order of the filter specified by b and a

Do not use filtfilt with differentiator and Hilbert FIR filters, because the operation of those filters depends heavily on their phase response.

example

y = filtfilt(sos,g,x) zero-phase filters the input data x using the second-order section (biquad) filter represented by the matrix sos and the scale values g.

y = filtfilt(d,x) zero-phase filters the input data x using a digital filter d. Use designfilt to generate d based on frequency-response specifications.

example

y = filtfilt(B,A,x,"ctf") zero-phase filters the input data x using Cascaded Transfer Functions (CTF) defined by the numerator and denominator coefficients B and A, respectively. (since R2024b)

Note

Specify the "ctf" option to disambiguate CTF numerator matrices B with six columns from second-order section matrix inputs, sos, when you specify A as a scalar or vector.

example

y = filtfilt({B,A,g},x) includes the filter scalar values, g, in the filtering of the input data, x. (since R2024b)

example

y = filtfilt(___,Name=Value) specifies additional options using name-value arguments. (since R2026a)

Examples

collapse all

Zero-phase filtering helps preserve features in a filtered time waveform exactly where they occur in the unfiltered signal.

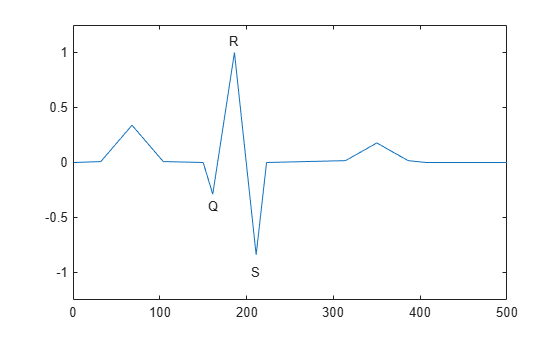
Zero-phase filter a synthetic electrocardiogram (ECG) waveform. The function that generates the waveform is at the end of the example. The QRS complex is an important feature in the ECG. Here it begins around time point 160.

wform = ecg(500);

plot(wform)
axis([0 500 -1.25 1.25])
text(155,-0.4,"Q")
text(180,1.1,"R")
text(205,-1,"S")

Figure contains an axes object. The axes object contains 4 objects of type line, text.

Corrupt the ECG with additive noise. Reset the random number generator for reproducible results. Construct a lowpass FIR equiripple filter and filter the noisy waveform using both zero-phase and conventional filtering.

rng("default")

x = wform' + 0.25*randn(500,1);
d = designfilt("lowpassfir", ...
    PassbandFrequency=0.15,StopbandFrequency=0.2, ...
    PassbandRipple=1,StopbandAttenuation=60, ...
    DesignMethod="equiripple");
y = filtfilt(d,x);
y1 = filter(d,x);

tiledlayout("flow")
nexttile
plot([y y1])
title("Filtered Waveforms")
legend(["Zero-phase Filtering" "Conventional Filtering"])

nexttile
plot(wform)
title("Original Waveform")

Figure contains 2 axes objects. Axes object 1 with title Filtered Waveforms contains 2 objects of type line. These objects represent Zero-phase Filtering, Conventional Filtering. Axes object 2 with title Original Waveform contains an object of type line.

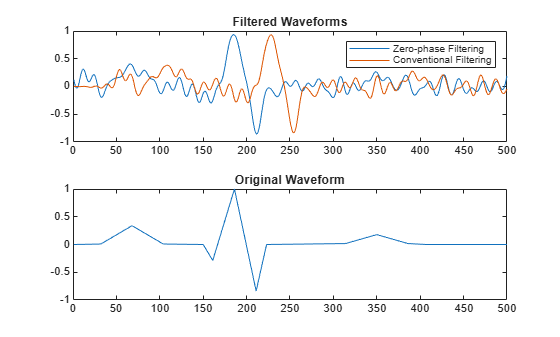
Zero-phase filtering reduces noise in the signal and preserves the QRS complex at the same time it occurs in the original. Conventional filtering reduces noise in the signal, but delays the QRS complex.

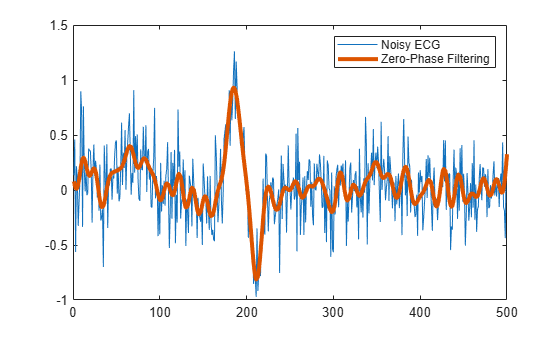
Repeat the filtering using a Butterworth second-order section filter.

d1 = designfilt("lowpassiir",FilterOrder=12, ...
    HalfPowerFrequency=0.15,DesignMethod="butter");
y = filtfilt(d1,x);

figure
plot(x)
hold on
plot(y,LineWidth=3)
hold off
legend(["Noisy ECG" "Zero-Phase Filtering"])

Figure contains an axes object. The axes object contains 2 objects of type line. These objects represent Noisy ECG, Zero-Phase Filtering.

This function generates the ECG waveform.

function x = ecg(L)
%ECG Electrocardiogram (ECG) signal generator.
%   ECG(L) generates a piecewise linear ECG signal of length L.
%
%   EXAMPLE:
%   x = ecg(500).';
%   y = sgolayfilt(x,0,3); % Typical values are: d=0 and F=3,5,9, etc. 
%   y5 = sgolayfilt(x,0,5); 
%   y15 = sgolayfilt(x,0,15); 
%   plot(1:length(x),[x y y5 y15]);

%   Copyright 1988-2002 The MathWorks, Inc.

a0 = [0,1,40,1,0,-34,118,-99,0,2,21,2,0,0,0]; % Template
d0 = [0,27,59,91,131,141,163,185,195,275,307,339,357,390,440];
a = a0/max(a0);
d = round(d0*L/d0(15)); % Scale them to fit in length L
d(15)=L;

for i=1:14
       m = d(i):d(i+1)-1;
       slope = (a(i+1)-a(i))/(d(i+1)-d(i));
       x(m+1) = a(i)+slope*(m-d(i));
end

end

Since R2024b

Use cascaded transfer functions to perform zero-phase filtering.

Design an elliptic filter with passband ripple and stopband attenuation of 0.1 dB and 40 dB, respectively. Specify a sample rate of 2000 Hz. Plot the frequency response of the filter.

Fs = 2000;
[B,A] = ellip(20,0.1,40,[0.3 0.7],"ctf");
freqz(B,A,2048,Fs,"ctf")

Figure contains 2 axes objects. Axes object 1 with title Phase, xlabel Frequency (kHz), ylabel Phase (degrees) contains an object of type line. Axes object 2 with title Magnitude, xlabel Frequency (kHz), ylabel Magnitude (dB) contains an object of type line.

Filter a linearly swept chirp signal, where the Nyquist frequency occurs at one second. Compare the spectra between the input and output signals.

t = 0:1/Fs:1;
x = chirp(t,0,t(end),Fs/2)';
y = filtfilt(B,A,x,"ctf");
pspectrum([x y],Fs,Leakage=1,FrequencyResolution=1)

Figure contains an axes object. The axes object with title Fres = 1 Hz, xlabel Frequency (kHz), ylabel Power Spectrum (dB) contains 2 objects of type line.

Since R2024b

Recreate noisy sinusoid artifacts with transfer-function zero-phase filtering. Filter an oscillating signal using CTF and scale values.

Create a signal u comprised of normally distributed noise and three sinusoidal waveforms. The sample rate is 1 kHz.

rng("default")
Fs = 1e3;
ts = (0:1/Fs:2)';

a0 = [3 2 1];
f0 = [0.1 0.5 0.9]*Fs/2;
p0 = [0 pi/4 pi/2];

u = 0.1*randn(size(ts)) + 0.1*sin(2*pi*f0.*ts+p0)*a0';

Recreate noisy sinusoid artifacts by filtering n0 with a third-order Butterworth bandstop digital filter and create a signal v.

[b,a] = butter(3,[0.15 0.85],"stop");
v = filtfilt(b,a,u);

Compare u and v. Observe that both signals are in phase.

tiledlayout("flow")
nexttile
strips([u(ts<0.1) v(ts<0.1)],0.1,Fs)
legend(["u" "v"],Location="southeast")
xlabel("Time (seconds)")
nexttile
pspectrum([u v],Fs)
legend(["u" "v"],Location="southeast")

Figure contains 2 axes objects. Axes object 1 with xlabel Time (seconds) contains 2 objects of type line. These objects represent u, v. Axes object 2 with title Fres = 1.2821 Hz, xlabel Frequency (Hz), ylabel Power Spectrum (dB) contains 2 objects of type line. These objects represent u, v.

Create a voltage-controlled oscillating signal x. Add noisy sinusoid artifacts represented by the signal v.

vo = exp(-2*abs(ts-1)).*sin(8*pi*ts);
x = vco(vo,[0.25 0.75]*Fs/2,Fs) + v;

Filter the signal x with a 24th-order Chebyshev type II filter. Use the CTF format and scale values (B,A,g).

[B,A,g] = cheby2(24,50,[0.2 0.8],"ctf");
y = filtfilt({B,A,g},x);

Compare the magnitude squared of the short-time Fourier transforms. Observe a sharp decrease in the magnitude at the stopbands.

tiledlayout("flow")
nexttile
stft(x,Fs,Window=bohmanwin(128),OverlapLength=120, ...
    FFTLength=512,FrequencyRange="onesided")
title("Input x")
nexttile
stft(y,Fs,Window=bohmanwin(128),OverlapLength=120, ...
    FFTLength=512,FrequencyRange="onesided")
title("Output y")

Figure contains 2 axes objects. Axes object 1 with title Input x, xlabel Time (s), ylabel Frequency (Hz) contains an object of type image. Axes object 2 with title Output y, xlabel Time (s), ylabel Frequency (Hz) contains an object of type image.

Since R2026a

Apply zero-phase filtering to a complex-valued 30 Hz sinusoidal tone with multiple harmonics at intervals of 60 Hz extending up to 600 Hz.

Create a two-second complex-valued signal with a sample rate of 600 Hz. The signal comprises a 10 V 30 Hz sine tone and has 10 harmonics with frequencies evenly distributed from 60 Hz to 600 Hz with amplitudes of 1 V each.

Fs = 600;
t = (0:1/Fs:2)';
x = 10*exp(1i*2*pi*30*t) + sum(exp(1i*2*pi*60*t*(0:9)),2);

Since the tone oscillates at 30 Hz and the undesired components have frequency peaks at each 60 Hz up to the tenth multiple, a 10th-order IIR comb notch filter is suitable to recover the tone, the signal of interest.

Define b and a as vectors representing the numerator and denominator coefficients of a 10th-order IIR comb notch filter with a quality factor of 35. To learn more about designing IIR comb filters with a specific order and quality factor, see iircomb (DSP System Toolbox).

b = [0.957 zeros(1,9) -0.957];
a = [1 zeros(1,9) -0.914];

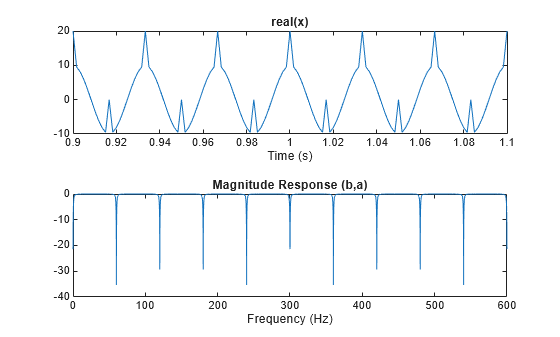
Plot the real part of the signal from 0.9 to 1.1 seconds. Plot the filter response from 0 to 600 Hz.

tiledlayout("flow")
nexttile
plot(t,real(x))
xlim([0.9 1.1])
xlabel("Time (s)")
title("real(x)")
nexttile
[h,f] = freqz(b,a,8192,"whole",Fs);
plot(f,mag2db(abs(h)))
xlabel("Frequency (Hz)")
title("Magnitude Response (b,a)")

Figure contains 2 axes objects. Axes object 1 with title real(x), xlabel Time (s) contains an object of type line. Axes object 2 with title Magnitude Response (b,a), xlabel Frequency (Hz) contains an object of type line.

Filter the input signal while preserving the phase. Use Gustafsson's technique to estimate the initial conditions of the filter states. Assume a transient length equal to the signal length and pad the input signal by mirroring its samples.

y = filtfilt(b,a,x, ...
    InitialStatesMethod="gustafsson", ...
    TransientLength=length(x), ...
    PaddingPattern="reflect");

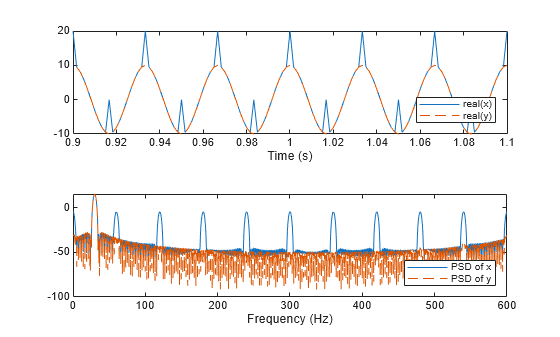
Compare the input and filtered signals in time domain and frequency domain. Plot the real part of both signals from 0.9 to 1.1 seconds, and Welch's power spectra from 0 to 600 Hz. The filtered signal shows the 30 Hz tone with the harmonics removed while the filtered signal y is in phase with the input signal x.

figure;
tiledlayout("vertical")
nexttile
plot(t,real(x),t,real(y),"--")
legend("real(" + ["x" "y"] +")",Location="southeast")
xlabel("Time (s)")
xlim([0.9 1.1])
nexttile
[p,f] = pwelch([x y],[],[],8192,Fs);
pdb = pow2db(abs(p));
plot(f,pdb(:,1),"-",f,pdb(:,2),"--")
xlabel("Frequency (Hz)")
legend("PSD of " + ["x" "y"],Location="southeast")

Figure contains 2 axes objects. Axes object 1 with xlabel Time (s) contains 2 objects of type line. These objects represent real(x), real(y). Axes object 2 with xlabel Frequency (Hz) contains 2 objects of type line. These objects represent PSD of x, PSD of y.

Input Arguments

collapse all

Transfer function coefficients, specified as vectors. If you use an all-pole filter, set b to 1. If you use an all-zero (FIR) filter, set a to 1.

Example: b = [1 3 3 1]/6 and a = [3 0 1 0]/3 specify a third-order Butterworth filter with a normalized 3 dB frequency of 0.5π rad/sample.

Data Types: double | single

Input signal, specified as a real-valued or complex-valued vector, matrix, or N-D array. x must be finite-valued. The length of x must be greater than three times the filter order, defined as max(length(B)-1, length(A)-1). The function operates along the first array dimension of x unless x is a row vector. If x is a row vector, then the function operates along the second dimension.

Example: cos(pi/4*(0:159))+randn(1,160) is a single-channel row-vector signal.

Example: cos(pi./[4;2]*(0:159))'+randn(160,2) is a two-channel signal.

Data Types: double | single
Complex Number Support: Yes

Second-order section coefficients, specified as a matrix. sos is a L-by-6 matrix where the number of sections L must be greater than or equal to 2. If the number of sections is less than 2, then the function treats the input as a numerator vector. Each row of sos corresponds to the coefficients of a second-order (biquad) filter. The ith row of sos corresponds to [bi(1) bi(2) bi(3) ai(1) ai(2) ai(3)].

Example: s = [2 4 2 6 0 2;3 3 0 6 0 0] specifies a third-order Butterworth filter with a normalized 3 dB frequency of 0.5π rad/sample.

Data Types: double | single

Scale values, specified as a real-valued scalar or as a real-valued vector with L + 1 elements, where L is the number of CTF sections. The scale values represent the distribution of the filter gain across sections of the cascaded filter representation.

The filtfilt function applies a gain to the filter sections using the scaleFilterSections function depending on how you specify g:

  • Scalar — The function distributes the gain uniformly across all filter sections.

  • Vector — The function applies the first L gain values to the corresponding filter sections and distributes the last gain value uniformly across all filter sections.

Data Types: double | single

Digital filter, specified as a digitalFilter object. Use designfilt to generate a digital filter based on frequency-response specifications.

Example: d = designfilt("lowpassiir",FilterOrder=3,HalfPowerFrequency=0.5) specifies a third-order Butterworth filter with a normalized 3 dB frequency of 0.5π rad/sample.

Cascaded transfer function (CTF) coefficients, specified as scalars, vectors, or matrices. B and A list the numerator and denominator coefficients of the cascaded transfer function, respectively.

B must be of size L-by-(m + 1) and A must be of size L-by-(n + 1), where:

  • L represents the number of filter sections.

  • m represents the order of the filter numerators.

  • n represents the order of the filter denominators.

For more information about the cascaded transfer function format and coefficient matrices, see Specify Digital Filters in CTF Format.

Note

If any element of A(:,1) is not equal to 1, then filtfilt normalizes the filter coefficients by A(:,1). In this case, A(:,1) must be nonzero.

Example: B = [2 4 2;3 3 0] and A = [6 0 2;6 0 0] specify a third-order Butterworth filter with normalized 3 dB frequency 0.5π rad/sample.

Data Types: double | single
Complex Number Support: Yes

Name-Value Arguments

collapse all

Specify optional pairs of arguments as Name1=Value1,...,NameN=ValueN, where Name is the argument name and Value is the corresponding value. Name-value arguments must appear after other arguments, but the order of the pairs does not matter.

Example: y = filtfilt(d,x,InitialStatesMethod="gustafsson") zero-phase filters the input signal x using the digital object d and applies Gustafsson's forward-backward least-square technique to compute optimal initial states.

Since R2026a

Method to estimate the initial conditions of the filter states (initial states), specified as one of these:

  • "const"filtfilt estimates the initial states by solving a linear system derived from the filter coefficients.

    • This method assumes a constant input signal and a system operating in steady state. Thus, the filtered signal starts at the steady-state value corresponding to a constant input signal.

    • If x is not constant, then the function uses its first sample to assume a constant input signal to use this method.

  • "gustafsson"filtfilt estimates the initial states using Gustafsson's forward-backward least-squares technique [1]. This method minimizes the energy of the difference between forward-backward and backward-forward filtered outputs, achieving symmetry and reducing boundary artifacts at both ends.

  • "zero"filtfilt sets all initial states to zero. This method has the least computational complexity and is independent from the input signal or the filter response.

Since R2026a

Length of the transient response (transient length), specified as "filtord", "stepzlen", or a nonnegative integer less than or equal to length(x).

The transient length represents the number of samples that filtfilt uses to model and suppress the transient response at the beginning and end of the filtered signal.

  • "filtord"filtfilt uses a transient length of three times the filter order.

  • "stepzlen"filtfilt uses a transient length based on the settling time of the step response of the filter.

    For a filter with a step response s[k] and a steady-state value sfinal, the function determines the transient length as the smallest index k such that |s[k] – sfinal| < 0.02×max(|s[k] – sfinal|).

    If k is greater than the signal length, then the function uses the signal length length(x) as the transient length.

  • Nonnegative integer less than or equal to length(x)filtfilt uses the specified transient length.

If you specify PaddingPatern as "none", then filtfilt ignores the value you specify in TransientLength and assumes no transient to model or suppress from the filtered signal.

Since R2026a

Pattern to pad the input signal before filtering, specified as "linear", "reflect", or "none".

The function uses the value that you specify in TransientLength to determine the number of samples to pad the input signal x along its operating dimension. The function uses the padded samples to model and suppresses the modeled transient response from the filtered signal at both ends before it returns y.

This table lists the pattern names with a description and a sample of how each pattern pads the input data x = [a b c d ... j k l m].

Padding PatternDescriptionPadded Data
"linear"

The function pads the input signal at both ends in a way that preserves the slope continuity at the boundaries.

This padding pattern ensures a smooth continuation of the signal into the transition region and helps suppress boundary transients.

"reflect"The function pads the input signal by mirroring samples on each end without duplicating the endpoints.

"none"

The function does not pad the input signal.

In this case, filtfilt also ignores the value specified in TransientLength.

Output Arguments

collapse all

Filtered signal, returned as a vector, matrix, or N-D array.

  • The filtfilt function returns y with the same size as x.

  • If you specify any input argument as type single, then filtfilt performs the filtering operation using single-precision arithmetic, and returns y as type single. Otherwise, filtfilt returns y as type double.

More About

collapse all

Tips

You can obtain filters in CTF format, including the scaling gain. Use the outputs of digital IIR filter design functions, such as butter, cheby1, cheby2, and ellip. Specify the "ctf" filter-type argument in these functions and specify to return B, A, and g to get the scale values. (since R2024b)

References

[1] Gustafsson, F. “Determining the initial states in forward-backward filtering.” IEEE® Transactions on Signal Processing. Vol. 44, April 1996, pp. 988–992. https://doi.org/10.1109/78.492552.

[2] Lyons, Richard G. Understanding Digital Signal Processing. Upper Saddle River, NJ: Prentice Hall, 2004.

[3] Mitra, Sanjit K. Digital Signal Processing. 2nd Ed. New York: McGraw-Hill, 2001.

[4] Oppenheim, Alan V., and Ronald W. Schafer, with John R. Buck. Discrete-Time Signal Processing. 2nd Ed. Upper Saddle River, NJ: Prentice Hall, 1999.

Extended Capabilities

expand all

Version History

Introduced before R2006a

expand all