Group Chart Objects by Using Boxes
A box is a graphical object that defines a namespace that you can use to organize objects in your chart, such as states, functions, and data. Boxes allow you to quickly glance at your chart and recognize which states or functions work together to perform certain tasks.
Note
Boxes have square corners to distinguish them from states, which have rounded corners.
To add notes to your Stateflow chart, use annotations instead of boxes. For more information, see Add Descriptive Comments in a Chart.
In this chart, the box Heater groups together the related states
Off and On.
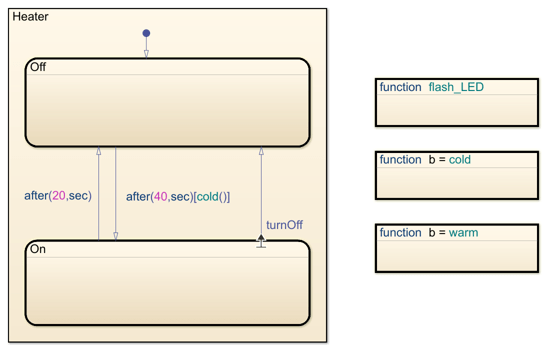
For more information about this example, see Model Bang-Bang Temperature Control System.
Semantics of Stateflow Boxes
Hierarchy of Graphical Objects in Boxes
Boxes add a level of hierarchy to Stateflow® charts. If you refer to a box-parented function or state from outside of the box, you must include the box name in the path. See Group Functions Using a Box.
Guidelines for Using Boxes
When you use a box:
Include the box name in the path when you use dot notation to refer to a box-parented function or state from a location outside of the box.
You can add data to a box so that all the elements in the box can share the same data.
You can group a box and its contents into a single graphical element. See Group States.
You can subchart a box to hide its elements. See Encapsulate Modal Logic by Using Subcharts.
You cannot define action statements for a box, such as
entry,during, andexitactions.You cannot define a transition to or from a box. However, you can define a transition to or from a state within a box.
Draw and Edit a Box
Create a Box
You create boxes in your chart by using the Box icon in the object palette.
In the object palette, click the Box tool
 .
.On the chart canvas, click the location for the new box. The new box appears with the cursor in place to add a name.
Enter a name for the box and then click outside of the box.
Delete a Box
To delete a box, click the box and press the Delete key.
Examples of Using Boxes
Group Functions Using a Box
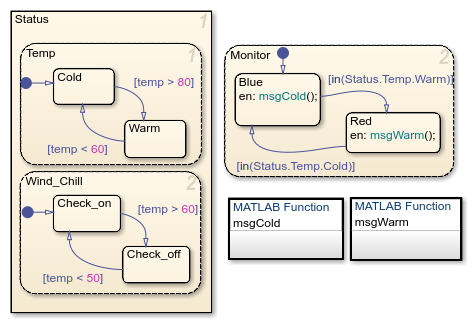
This chart shows a box named Status that groups two
MATLAB® functions.

The chart executes in this order:
The state
Coldactivates first.Upon entry, the state
Coldinvokes the functionStatus.msgCold.This function displays a status message that the temperature is cold.
Note
Because the MATLAB function resides inside a box, the path of the function call must include the box name
Status. If you omit this prefix, an error message appears.If the value of the input data
tempexceeds 80, a transition to the stateWarmoccurs.Upon entry, the state
Warminvokes the functionStatus.msgWarm.This function displays a status message that the temperature is warm.
If the value of the input data
tempdrops below 60, a transition to the stateColdoccurs.Steps 2 through 5 repeat until the simulation ends.
Group States Using a Box
This chart shows a box named Status that groups related
states.
In this chart:
The state
Tempwakes up first, followed by the stateWind_Chill. Then, the stateMonitorwakes up.This activation order occurs because
TempandWind_Chillare in a box with a priority of 1. If you remove the box, the activation order changes toTemp,Monitor, thenWind_Chill, because the states were created in this order. For more information, see Order Maintenance for Parallel States.
Based on the input data
temp, transitions between substates occur in the parallel statesStatus.TempandStatus.Wind_Chill.When the transition from
Status.Temp.ColdtoStatus.Temp.Warmoccurs, the transition conditionin(Status.Temp.Warm)becomes true.When the transition from
Status.Temp.WarmtoStatus.Temp.Coldoccurs, the transition conditionin(Status.Temp.Cold)becomes true.Because the substates
Status.Temp.ColdandStatus.Temp.Warmare inside a box, the argument of theinoperator must include the box nameStatus. If you omit this prefix, an error message appears. For information about theinoperator, see Check State Activity by Using the in Operator.