Main Content

canoncorr

Canonical correlation

Description

[A,B] = canoncorr(X,Y) computes the sample canonical coefficients for the data matrices X and Y.

[A,B,r] = canoncorr(X,Y) also returns r, a vector of the sample canonical correlations.

[A,B,r,U,V] = canoncorr(X,Y) also returns U and V, matrices of the canonical scores for X and Y, respectively.

example

[A,B,r,U,V,stats] = canoncorr(X,Y) also returns stats, a structure containing information related to testing the sequence of hypotheses that the remaining correlations are all zero.

Examples

collapse all

Perform canonical correlation analysis for a sample data set.

The data set carbig contains measurements for 406 cars from the years 1970 to 1982.

Load the sample data.

load carbig;
data = [Displacement Horsepower Weight Acceleration MPG];

Define X as the matrix of displacement, horsepower, and weight observations, and Y as the matrix of acceleration and MPG observations. Omit rows with insufficient data.

nans = sum(isnan(data),2) > 0;
X = data(~nans,1:3);
Y = data(~nans,4:5);

Compute the sample canonical correlation.

[A,B,r,U,V] = canoncorr(X,Y);

View the output of A to determine the linear combinations of displacement, horsepower, and weight that make up the canonical variables of X.

A
A = 3×2

    0.0025    0.0048
    0.0202    0.0409
   -0.0000   -0.0027

A(3,1) is displayed as —0.000 because it is very small. Display A(3,1) separately.

A(3,1)
ans = 
-2.4737e-05

The first canonical variable of X is u1 = 0.0025*Disp + 0.0202*HP — 0.000025*Wgt.

The second canonical variable of X is u2 = 0.0048*Disp + 0.0409*HP — 0.0027*Wgt.

View the output of B to determine the linear combinations of acceleration and MPG that make up the canonical variables of Y.

B
B = 2×2

   -0.1666   -0.3637
   -0.0916    0.1078

The first canonical variable of Y is v1 = 0.1666*Accel — 0.0916*MPG.

The second canonical variable of Y is v2 = —0.3637*Accel + 0.1078*MPG.

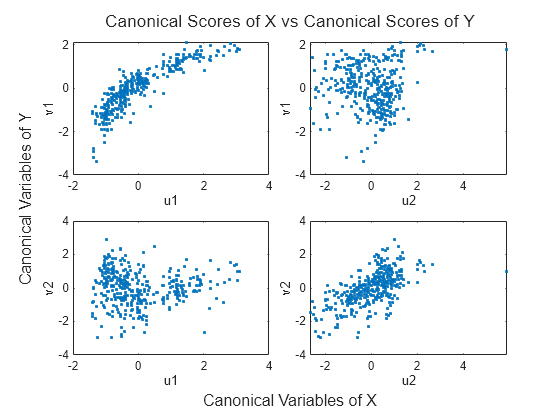
Plot the scores of the canonical variables of X and Y against each other.

t = tiledlayout(2,2);
title(t,'Canonical Scores of X vs Canonical Scores of Y')
xlabel(t,'Canonical Variables of X')
ylabel(t,'Canonical Variables of Y')
t.TileSpacing = 'compact';

nexttile
plot(U(:,1),V(:,1),'.')
xlabel('u1')
ylabel('v1')

nexttile
plot(U(:,2),V(:,1),'.')
xlabel('u2')
ylabel('v1')

nexttile
plot(U(:,1),V(:,2),'.')
xlabel('u1')
ylabel('v2')

nexttile
plot(U(:,2),V(:,2),'.')
xlabel('u2')
ylabel('v2')

Figure contains 4 axes objects. Axes object 1 with xlabel u1, ylabel v1 contains a line object which displays its values using only markers. Axes object 2 with xlabel u2, ylabel v1 contains a line object which displays its values using only markers. Axes object 3 with xlabel u1, ylabel v2 contains a line object which displays its values using only markers. Axes object 4 with xlabel u2, ylabel v2 contains a line object which displays its values using only markers.

The pairs of canonical variables {ui,vi} are ordered from the strongest to weakest correlation, with all other pairs independent.

Return the correlation coefficient of the variables u1 and v1.
r(1)
ans = 
0.8782

Input Arguments

collapse all

Input matrix, specified as an n-by-d1 matrix. The rows of X correspond to observations, and the columns correspond to variables.

Data Types: single | double

Input matrix, specified as an n-by-d2 matrix where X is an n-by-d1 matrix. The rows of Y correspond to observations, and the columns correspond to variables.

Data Types: single | double

Output Arguments

collapse all

Sample canonical coefficients for the variables in X, returned as a d1-by-d matrix, where d = min(rank(X),rank(Y)).

The jth column of A contains the linear combination of variables that makes up the jth canonical variable for X.

If X is less than full rank, canoncorr gives a warning and returns zeros in the rows of A corresponding to dependent columns of X.

Sample canonical coefficients for the variables in Y, returned as a d2-by-d matrix, where d = min(rank(X),rank(Y)).

The jth column of B contains the linear combination of variables that makes up the jth canonical variable for Y.

If Y is less than full rank, canoncorr gives a warning and returns zeros in the rows of B corresponding to dependent columns of Y.

Sample canonical correlations, returned as a 1-by-d vector, where d = min(rank(X),rank(Y)).

The jth element of r is the correlation between the jth columns of U and V.

Canonical scores for the variables in X, returned as an n-by-d matrix, where X is an n-by-d1 matrix and d = min(rank(X),rank(Y)).

Canonical scores for the variables in Y, returned as an n-by-d matrix, where Y is an n-by-d2 matrix and d = min(rank(X),rank(Y)).

Hypothesis test information, returned as a structure. This information relates to the sequence of d null hypotheses H0(k) that the (k+1)st through dth correlations are all zero for k=1,…,d-1, and d = min(rank(X),rank(Y)).

The fields of stats are 1-by-d vectors with elements corresponding to the values of k.

FieldDescription
Wilks

Wilks' lambda (likelihood ratio) statistic

df1

Degrees of freedom for the chi-square statistic, and the numerator degrees of freedom for the F statistic

df2

Denominator degrees of freedom for the F statistic

F

Rao's approximate F statistic for H0(k)

pF

Right-tail significance level for F

chisq

Bartlett's approximate chi-square statistic for H0(k) with Lawley's modification

pChisq

Right-tail significance level for chisq

stats has two other fields (dfe and p), which are equal to df1 and pChisq, respectively, and exist for historical reasons.

Data Types: struct

More About

collapse all

Algorithms

canoncorr computes A, B, and r using qr and svd. canoncorr computes U and V as U = (X—mean(X))*A and V = (Y—mean(Y))*B.

References

[1] Krzanowski, W. J. Principles of Multivariate Analysis: A User's Perspective. New York: Oxford University Press, 1988.

[2] Seber, G. A. F. Multivariate Observations. Hoboken, NJ: John Wiley & Sons, Inc., 1984.

Version History

Introduced before R2006a

See Also

|