Main Content

fscmrmr

Rank features for classification using minimum redundancy maximum relevance (MRMR) algorithm

Since R2019b

Description

fscmrmr ranks features (predictors) using the MRMR algorithm to identify important predictors for classification problems.

To perform MRMR-based feature ranking for regression, see fsrmrmr.

idx = fscmrmr(Tbl,ResponseVarName) returns the predictor indices, idx, ordered by predictor importance (from most important to least important). The table Tbl contains the predictor variables and a response variable, ResponseVarName, which contains the class labels. You can use idx to select important predictors for classification problems.

idx = fscmrmr(Tbl,formula) specifies a response variable and predictor variables to consider among the variables in Tbl by using formula.

example

idx = fscmrmr(Tbl,Y) ranks predictors in Tbl using the response variable Y.

example

idx = fscmrmr(X,Y) ranks predictors in X using the response variable Y.

idx = fscmrmr(___,Name,Value) specifies additional options using one or more name-value pair arguments in addition to any of the input argument combinations in the previous syntaxes. For example, you can specify prior probabilities and observation weights.

[idx,scores] = fscmrmr(___) also returns the predictor scores scores. A large score value indicates that the corresponding predictor is important.

Examples

collapse all

Load the sample data.

load ionosphere

Rank the predictors based on importance.

[idx,scores] = fscmrmr(X,Y);

Create a bar plot of the predictor importance scores.

bar(scores(idx))
xlabel('Predictor rank')
ylabel('Predictor importance score')

Figure contains an axes object. The axes object with xlabel Predictor rank, ylabel Predictor importance score contains an object of type bar.

The drop in score between the first and second most important predictors is large, while the drops after the sixth predictor are relatively small. A drop in the importance score represents the confidence of feature selection. Therefore, the large drop implies that the software is confident of selecting the most important predictor. The small drops indicate that the difference in predictor importance are not significant.

Select the top five most important predictors. Find the columns of these predictors in X.

idx(1:5)
ans = 1×5

     5     4     1     7    24

The fifth column of X is the most important predictor of Y.

Find important predictors by using fscmrmr. Then compare the accuracies of the full classification model (which uses all the predictors) and a reduced model that uses the five most important predictors by using testckfold.

Load the census1994 data set.

load census1994

The table adultdata in census1994 contains demographic data from the US Census Bureau to predict whether an individual makes over $50,000 per year. Display the first three rows of the table.

head(adultdata,3)
    age       workClass          fnlwgt      education    education_num      marital_status         occupation        relationship     race     sex     capital_gain    capital_loss    hours_per_week    native_country    salary
    ___    ________________    __________    _________    _____________    __________________    _________________    _____________    _____    ____    ____________    ____________    ______________    ______________    ______

    39     State-gov                77516    Bachelors         13          Never-married         Adm-clerical         Not-in-family    White    Male        2174             0                40          United-States     <=50K 
    50     Self-emp-not-inc         83311    Bachelors         13          Married-civ-spouse    Exec-managerial      Husband          White    Male           0             0                13          United-States     <=50K 
    38     Private             2.1565e+05    HS-grad            9          Divorced              Handlers-cleaners    Not-in-family    White    Male           0             0                40          United-States     <=50K 

The output arguments of fscmrmr include only the variables ranked by the function. Before passing a table to the function, move the variables that you do not want to rank, including the response variable and weight, to the end of the table so that the order of the output arguments is consistent with the order of the table.

In the table adultdata, the third column fnlwgt is the weight of the samples, and the last column salary is the response variable. Move fnlwgt to the left of salary by using the movevars function.

adultdata = movevars(adultdata,'fnlwgt','before','salary');
head(adultdata,3)
    age       workClass        education    education_num      marital_status         occupation        relationship     race     sex     capital_gain    capital_loss    hours_per_week    native_country      fnlwgt      salary
    ___    ________________    _________    _____________    __________________    _________________    _____________    _____    ____    ____________    ____________    ______________    ______________    __________    ______

    39     State-gov           Bachelors         13          Never-married         Adm-clerical         Not-in-family    White    Male        2174             0                40          United-States          77516    <=50K 
    50     Self-emp-not-inc    Bachelors         13          Married-civ-spouse    Exec-managerial      Husband          White    Male           0             0                13          United-States          83311    <=50K 
    38     Private             HS-grad            9          Divorced              Handlers-cleaners    Not-in-family    White    Male           0             0                40          United-States     2.1565e+05    <=50K 

Rank the predictors in adultdata. Specify the column salary as the response variable.

[idx,scores] = fscmrmr(adultdata,'salary','Weights','fnlwgt');

Create a bar plot of predictor importance scores. Use the predictor names for the x-axis tick labels.

bar(scores(idx))
xlabel('Predictor rank')
ylabel('Predictor importance score')
xticklabels(strrep(adultdata.Properties.VariableNames(idx),'_','\_'))
xtickangle(45)

Figure contains an axes object. The axes object with xlabel Predictor rank, ylabel Predictor importance score contains an object of type bar.

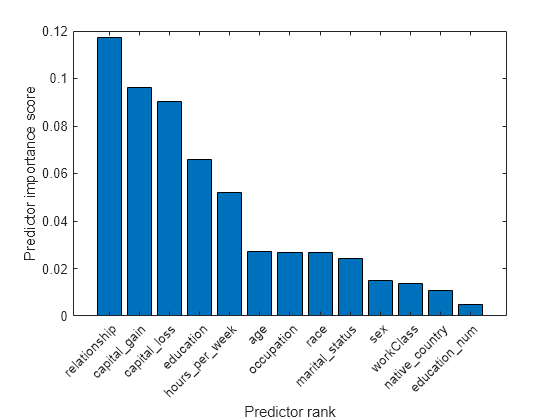
The five most important predictors are relationship, capital_loss, capital_gain, education, and hours_per_week.

Compare the accuracy of a classification tree trained with all predictors to the accuracy of one trained with the five most important predictors.

Create a classification tree template using the default options.

C = templateTree;

Define the table tbl1 to contain all predictors and the table tbl2 to contain the five most important predictors.

tbl1 = adultdata(:,adultdata.Properties.VariableNames(idx(1:13)));
tbl2 = adultdata(:,adultdata.Properties.VariableNames(idx(1:5)));

Pass the classification tree template and the two tables to the testckfold function. The function compares the accuracies of the two models by repeated cross-validation. Specify 'Alternative','greater' to test the null hypothesis that the model with all predictors is, at most, as accurate as the model with the five predictors. The 'greater' option is available when 'Test' is '5x2t' (5-by-2 paired t test) or '10x10t' (10-by-10 repeated cross-validation t test).

[h,p] = testckfold(C,C,tbl1,tbl2,adultdata.salary,'Weights',adultdata.fnlwgt,'Alternative','greater','Test','5x2t')
h = logical
   0

p = 0.9969

h equals 0 and the p-value is almost 1, indicating failure to reject the null hypothesis. Using the model with the five predictors does not result in loss of accuracy compared to the model with all the predictors.

Now train a classification tree using the selected predictors.

mdl = fitctree(adultdata,'salary ~ relationship + capital_loss + capital_gain + education +  hours_per_week', ...
    'Weights',adultdata.fnlwgt)
mdl = 
  ClassificationTree
           PredictorNames: {'education'  'relationship'  'capital_gain'  'capital_loss'  'hours_per_week'}
             ResponseName: 'salary'
    CategoricalPredictors: [1 2]
               ClassNames: [<=50K    >50K]
           ScoreTransform: 'none'
          NumObservations: 32561


Input Arguments

collapse all

Sample data, specified as a table. Multicolumn variables and cell arrays other than cell arrays of character vectors are not allowed.

Each row of Tbl corresponds to one observation, and each column corresponds to one predictor variable. Optionally, Tbl can contain additional columns for a response variable and observation weights.

A response variable can be a categorical, character, or string array, logical or numeric vector, or cell array of character vectors. If the response variable is a character array, then each element of the response variable must correspond to one row of the array.

  • If Tbl contains the response variable, and you want to use all remaining variables in Tbl as predictors, then specify the response variable by using ResponseVarName. If Tbl also contains the observation weights, then you can specify the weights by using Weights.

  • If Tbl contains the response variable, and you want to use only a subset of the remaining variables in Tbl as predictors, then specify the subset of variables by using formula.

  • If Tbl does not contain the response variable, then specify a response variable by using Y. The response variable and Tbl must have the same number of rows.

If fscmrmr uses a subset of variables in Tbl as predictors, then the function indexes the predictors using only the subset. The values in the 'CategoricalPredictors' name-value pair argument and the output argument idx do not count the predictors that the function does not rank.

fscmrmr considers NaN, '' (empty character vector), "" (empty string), <missing>, and <undefined> values in Tbl for a response variable to be missing values. fscmrmr does not use observations with missing values for a response variable.

Data Types: table

Response variable name, specified as a character vector or string scalar containing the name of a variable in Tbl.

For example, if a response variable is the column Y of Tbl (Tbl.Y), then specify ResponseVarName as "Y".

Data Types: char | string

Explanatory model of the response variable and a subset of the predictor variables, specified as a character vector or string scalar in the form "Y ~ x1 + x2 + x3". In this form, Y represents the response variable, and x1, x2, and x3 represent the predictor variables.

To specify a subset of variables in Tbl as predictors, use a formula. If you specify a formula, then fscmrmr does not rank any variables in Tbl that do not appear in formula.

The variable names in the formula must be both variable names in Tbl (Tbl.Properties.VariableNames) and valid MATLAB® identifiers. You can verify the variable names in Tbl by using the isvarname function. If the variable names are not valid, then you can convert them by using the matlab.lang.makeValidName function.

Data Types: char | string

Response variable, specified as a numeric, categorical, or logical vector, a character or string array, or a cell array of character vectors. Each row of Y represents the labels of the corresponding row of X.

fscmrmr considers NaN, '' (empty character vector), "" (empty string), <missing>, and <undefined> values in Y to be missing values. fscmrmr does not use observations with missing values for Y.

Data Types: single | double | categorical | logical | char | string | cell

Predictor data, specified as a numeric matrix. Each row of X corresponds to one observation, and each column corresponds to one predictor variable.

Data Types: single | double

Name-Value Arguments

Specify optional pairs of arguments as Name1=Value1,...,NameN=ValueN, where Name is the argument name and Value is the corresponding value. Name-value arguments must appear after other arguments, but the order of the pairs does not matter.

Before R2021a, use commas to separate each name and value, and enclose Name in quotes.

Example: 'CategoricalPredictors',[1 2],'Verbose',2 specifies the first two predictor variables as categorical variables and specifies the verbosity level as 2.

List of categorical predictors, specified as one of the values in this table.

ValueDescription
Vector of positive integers

Each entry in the vector is an index value indicating that the corresponding predictor is categorical. The index values are between 1 and p, where p is the number of predictors used to train the model.

If fscmrmr uses a subset of input variables as predictors, then the function indexes the predictors using only the subset. The CategoricalPredictors values do not count the response variable, observation weights variable, or any other variables that the function does not use.

Logical vector

A true entry means that the corresponding predictor is categorical. The length of the vector is p.

Character matrixEach row of the matrix is the name of a predictor variable. The names must match the names in Tbl. Pad the names with extra blanks so each row of the character matrix has the same length.
String array or cell array of character vectorsEach element in the array is the name of a predictor variable. The names must match the names in Tbl.
"all"All predictors are categorical.

By default, if the predictor data is a table (Tbl), fscmrmr assumes that a variable is categorical if it is a logical vector, unordered categorical vector, character array, string array, or cell array of character vectors. If the predictor data is a matrix (X), fscmrmr assumes that all predictors are continuous. To identify any other predictors as categorical predictors, specify them by using the CategoricalPredictors name-value argument.

Example: "CategoricalPredictors","all"

Example: CategoricalPredictors=[1 5 6 8]

Data Types: single | double | logical | char | string | cell

Names of the classes to use for ranking, specified as the comma-separated pair consisting of 'ClassNames' and a categorical, character, or string array, a logical or numeric vector, or a cell array of character vectors. ClassNames must have the same data type as Y or the response variable in Tbl.

If ClassNames is a character array, then each element must correspond to one row of the array.

Use 'ClassNames' to:

  • Specify the order of the Prior dimensions that corresponds to the class order.

  • Select a subset of classes for ranking. For example, suppose that the set of all distinct class names in Y is {'a','b','c'}. To rank predictors using observations from classes 'a' and 'c' only, specify 'ClassNames',{'a','c'}.

The default value for 'ClassNames' is the set of all distinct class names in Y or the response variable in Tbl. The default 'ClassNames' value has mathematical ordering if the response variable is ordinal. Otherwise, the default value has alphabetical ordering.

Example: 'ClassNames',{'b','g'}

Data Types: categorical | char | string | logical | single | double | cell

Prior probabilities for each class, specified as one of the following:

  • Character vector or string scalar.

    • 'empirical' determines class probabilities from class frequencies in the response variable in Y or Tbl. If you pass observation weights, fscmrmr uses the weights to compute the class probabilities.

    • 'uniform' sets all class probabilities to be equal.

  • Vector (one scalar value for each class). To specify the class order for the corresponding elements of 'Prior', set the 'ClassNames' name-value argument.

  • Structure S with two fields.

    • S.ClassNames contains the class names as a variable of the same type as the response variable in Y or Tbl.

    • S.ClassProbs contains a vector of corresponding probabilities.

fscmrmr normalizes the weights in each class ('Weights') to add up to the value of the prior probability of the respective class.

Example: 'Prior','uniform'

Data Types: char | string | single | double | struct

Indicator for whether to use missing values in predictors, specified as either true to use the values for ranking, or false to discard the values.

fscmrmr considers NaN, '' (empty character vector), "" (empty string), <missing>, and <undefined> values to be missing values.

If you specify UseMissing as true, then fscmrmr uses missing values for ranking. For a categorical variable, fscmrmr treats missing values as an extra category. For a continuous variable, fscmrmr places NaN values in a separate bin for binning.

If you specify UseMissing as false, then fscmrmr does not use missing values for ranking. Because fscmrmr computes mutual information for each pair of variables, the function does not discard an entire row when values in the row are partially missing. fscmrmr uses all pair values that do not include missing values.

Example: "UseMissing",true

Example: UseMissing=true

Data Types: logical

Verbosity level, specified as the comma-separated pair consisting of 'Verbose' and a nonnegative integer. The value of Verbose controls the amount of diagnostic information that the software displays in the Command Window.

  • 0 — fscmrmr does not display any diagnostic information.

  • 1 — fscmrmr displays the elapsed times for computing Mutual Information and ranking predictors.

  • ≥ 2 — fscmrmr displays the elapsed times and more messages related to computing mutual information. The amount of information increases as you increase the 'Verbose' value.

Example: 'Verbose',1

Data Types: single | double

Observation weights, specified as the comma-separated pair consisting of 'Weights' and a vector of scalar values or the name of a variable in Tbl. The function weights the observations in each row of X or Tbl with the corresponding value in Weights. The size of Weights must equal the number of rows in X or Tbl.

If you specify the input data as a table Tbl, then Weights can be the name of a variable in Tbl that contains a numeric vector. In this case, you must specify Weights as a character vector or string scalar. For example, if the weight vector is the column W of Tbl (Tbl.W), then specify 'Weights,'W'.

fscmrmr normalizes the weights in each class to add up to the value of the prior probability of the respective class.

Data Types: single | double | char | string

Output Arguments

collapse all

Indices of predictors in X or Tbl ordered by predictor importance, returned as a 1-by-r numeric vector, where r is the number of ranked predictors.

If fscmrmr uses a subset of variables in Tbl as predictors, then the function indexes the predictors using only the subset. For example, suppose Tbl includes 10 columns and you specify the last five columns of Tbl as the predictor variables by using formula. If idx(3) is 5, then the third most important predictor is the 10th column in Tbl, which is the fifth predictor in the subset.

Predictor scores, returned as a 1-by-r numeric vector, where r is the number of ranked predictors.

A large score value indicates that the corresponding predictor is important. Also, a drop in the feature importance score represents the confidence of feature selection. For example, if the software is confident of selecting a feature x, then the score value of the next most important feature is much smaller than the score value of x.

  • If you use X to specify the predictors or use all the variables in Tbl as predictors, then the values in scores have the same order as the predictors in X or Tbl.

  • If you specify a subset of variables in Tbl as predictors, then the values in scores have the same order as the subset.

For example, suppose Tbl includes 10 columns and you specify the last five columns of Tbl as the predictor variables by using formula. Then, score(3) contains the score value of the 8th column in Tbl, which is the third predictor in the subset.

More About

collapse all

Mutual Information

The mutual information between two variables measures how much uncertainty of one variable can be reduced by knowing the other variable.

The mutual information I of the discrete random variables X and Z is defined as

I(X,Z)=i,jP(X=xi,Z=zj)logP(X=xi,Z=zj)P(X=xi)P(Z=zj).

If X and Z are independent, then I equals 0. If X and Z are the same random variable, then I equals the entropy of X.

The fscmrmr function uses this definition to compute the mutual information values for both categorical (discrete) and continuous variables. fscmrmr discretizes a continuous variable into 256 bins or the number of unique values in the variable if it is less than 256. The function finds optimal bivariate bins for each pair of variables using the adaptive algorithm [2].

Algorithms

collapse all

Minimum Redundancy Maximum Relevance (MRMR) Algorithm

The MRMR algorithm [1] finds an optimal set of features that is mutually and maximally dissimilar and can represent the response variable effectively. The algorithm minimizes the redundancy of a feature set and maximizes the relevance of a feature set to the response variable. The algorithm quantifies the redundancy and relevance using the mutual information of variables—pairwise mutual information of features and mutual information of a feature and the response. You can use this algorithm for classification problems.

The goal of the MRMR algorithm is to find an optimal set S of features that maximizes VS, the relevance of S with respect to a response variable y, and minimizes WS, the redundancy of S, where VS and WS are defined with mutual information I:

VS=1|S|xSI(x,y),

WS=1|S|2x,zSI(x,z).

|S| is the number of features in S.

Finding an optimal set S requires considering all 2|Ω| combinations, where Ω is the entire feature set. Instead, the MRMR algorithm ranks features through the forward addition scheme, which requires O(|Ω|·|S|) computations, by using the mutual information quotient (MIQ) value.

MIQx=VxWx,

where Vx and Wx are the relevance and redundancy of a feature, respectively:

Vx=I(x,y),

Wx=1|S|zSI(x,z).

The fscmrmr function ranks all features in Ω and returns idx (the indices of features ordered by feature importance) using the MRMR algorithm. Therefore, the computation cost becomes O(|Ω|2). The function quantifies the importance of a feature using a heuristic algorithm and returns a score (scores). A large score value indicates that the corresponding predictor is important. Also, a drop in the feature importance score represents the confidence of feature selection. For example, if the software is confident of selecting a feature x, then the score value of the next most important feature is much smaller than the score value of x. You can use the outputs to find an optimal set S for a given number of features.

fscmrmr ranks features as follows:

  1. Select the feature with the largest relevance, maxxΩVx. Add the selected feature to an empty set S.

  2. Find the features with nonzero relevance and zero redundancy in the complement of S, Sc.

    • If Sc does not include a feature with nonzero relevance and zero redundancy, go to step 4.

    • Otherwise, select the feature with the largest relevance, maxxSc,Wx=0Vx. Add the selected feature to the set S.

  3. Repeat Step 2 until the redundancy is not zero for all features in Sc.

  4. Select the feature that has the largest MIQ value with nonzero relevance and nonzero redundancy in Sc, and add the selected feature to the set S.

    maxxScMIQx=maxxScI(x,y)1|S|zSI(x,z).

  5. Repeat Step 4 until the relevance is zero for all features in Sc.

  6. Add the features with zero relevance to S in random order.

The software can skip any step if it cannot find a feature that satisfies the conditions described in the step.

References

[1] Ding, C., and H. Peng. "Minimum redundancy feature selection from microarray gene expression data." Journal of Bioinformatics and Computational Biology. Vol. 3, Number 2, 2005, pp. 185–205.

[2] Darbellay, G. A., and I. Vajda. "Estimation of the information by an adaptive partitioning of the observation space." IEEE Transactions on Information Theory. Vol. 45, Number 4, 1999, pp. 1315–1321.

Version History

Introduced in R2019b

expand all