plotprofile
Description
lines = plotprofile(___)Line objects for the lines in the plot.
Examples
Load the fisheriris data set.
load fisheririsThe column vector species contains iris flowers of three different species: setosa, versicolor, and virginica. The matrix meas contains four types of measurements for the flower: the length and width of sepals and petals in centimeters.
Perform a one-way MANOVA with species as the factor and the measurements in meas as the response variables.
maov = manova(species,meas,FactorNames="species",ResponseNames=["SepalLength" "SepalWidth"...
    "PetalLength" "PetalWidth"])
maov =
1-way manova

SepalLength,SepalWidth,PetalLength,PetalWidth ~ 1 + species

    Source     DF     TestStatistic    Value       F       DFNumerator    DFDenominator      pValue
    _______    ___    _____________    ______    ______    ___________    _____________    __________

    species      2       pillai        1.1919    53.466          8             290         9.7422e-53
    Error      147
    Total      149


  Properties, Methods
maov is a manova object that contains the results of the one-way MANOVA. The small p-value for species indicates that the flower species has a statistically significant effect on at least one of the flower measurements.
Create a profile plot of the mean measurements for each flower species.
plotprofile(maov)
legend
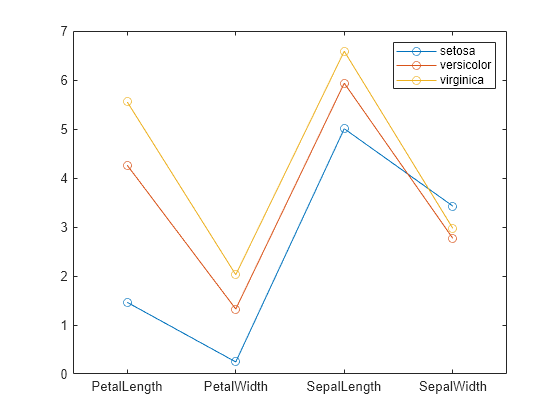
The profile plot shows that the means are the most spread out for the petal length measurement, and that setosa has smaller measurements, on average, than the other two flower species.
Load the carsmall data set.
load carsmallThe variable Model_Year contains data for the year a car was manufactured, and the variable Cylinders contains data for the number of engine cylinders in the car. The Acceleration and Displacement variables contain data for car acceleration and displacement.
Use the table function to create a table from the data in Model_Year, Cylinders, Acceleration, and Displacement.
tbl = table(Model_Year,Cylinders,Acceleration,Displacement,VariableNames=["Year" "Cylinders" "Acceleration" "Displacement"]);
Perform a two-way MANOVA using the table variables Year and Cylinders as factors, and the Acceleration and Displacement variables as response variables.
maov = manova(tbl,"Acceleration,Displacement ~ Cylinders + Year")maov =
2-way manova
Acceleration,Displacement ~ 1 + Year + Cylinders
Source DF TestStatistic Value F DFNumerator DFDenominator pValue
_________ __ _____________ ________ ______ ___________ _____________ __________
Year 2 pillai 0.084893 2.1056 4 190 0.081708
Cylinders 2 pillai 0.94174 42.27 4 190 2.5049e-25
Error 95
Total 99
Properties, Methods
maov is a manova object that contains the results of the two-way MANOVA. The table output shows that the p-value for the MANOVA model term Year is too large to conclude that Year has a statistically significant effect on the mean response vector. However, the small p-value for Cylinders indicates that enough evidence exists to conclude that Cylinders has a statistically significant effect on the mean response vector.
Create a profile plot of the means for Acceleration and Displacement grouped by the combinations of values for Year and Cylinders. Use the axes function to create axes that plot lines in magenta, green, and black.
lineColors = [1 0 1; 0 1 0; 0 0 0];
ax = axes(ColorOrder=lineColors);
plotprofile(ax,maov,["Year" "Cylinders"])
legend
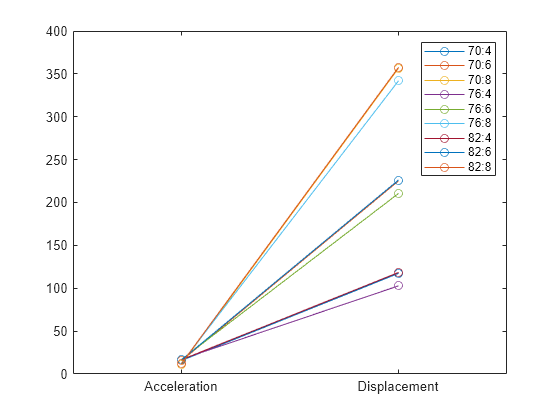
The profile plot shows that the means for Acceleration are similar. However, the color coding shows that the means for Displacement are clustered by their corresponding values in Cylinders. The top cluster, shown in black, corresponds to cars with eight-cylinder engines. The middle cluster, shown in green, corresponds to cars with six-cylinder engines. The bottom cluster, shown in magenta, corresponds to cars with four-cylinder engines. This result supports the conclusion that Cylinders has a statistically significant effect on the mean response vector, but Year does not.
Input Arguments
Output Arguments
Version History
Introduced in R2023b