Results for
Is it possible to create a Simulink model that is independent of specific microcontrollers?
For example, in the model, the STM32 block is used for CAN transmission. But if I want to deploy the same model to an Arduino, I have to replace the STM32 block with an Arduino-compatible one.
So, is it possible to create a custom block or abstraction that works across multiple microcontrollers like STM32, PIC32, and Arduino without changing the hardware-specific block each time?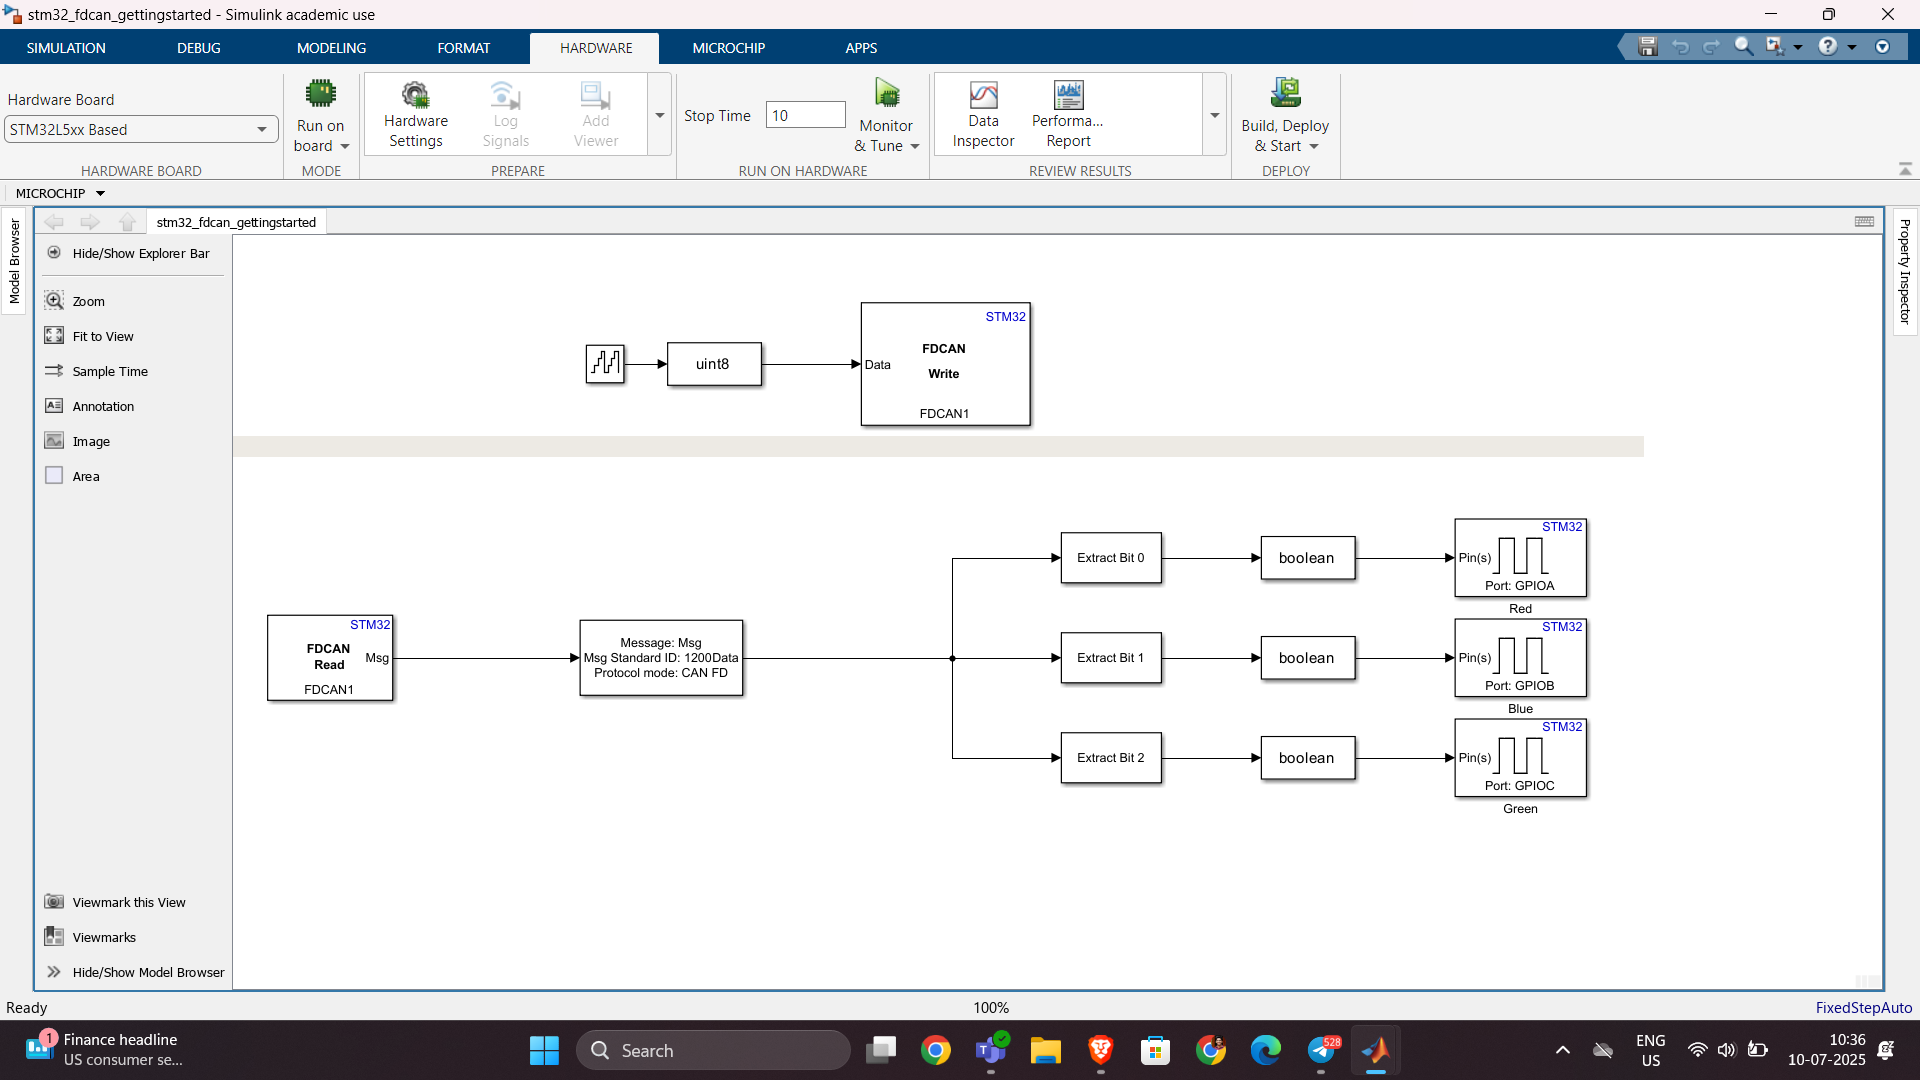
Hello,
I've successfully tested the Processor-in-the-Loop (PIL) workflow in Simulink using a TI F28069M LaunchPad, following the standard examples provided by MathWorks. The PIL block, code generation, and communication all worked without issues.
Now, I’d like to run a similar PIL setup using the Infineon TLE9879 EVALKIT (based on an ARM Cortex-M0), which is not officially supported by Simulink as a target.
I’m wondering if it’s possible to configure PIL manually or via custom workflows. For example:
- Can I create a custom PIL target using Embedded Coder?
- Would I need to port rtiostream manually for communication over UART?
- Could I somehow integrate with Keil µVision (which I use for TLE9879) to build and run the generated code?
- Is there a workaround to simulate PIL behavior using a non-supported board?
My setup:
- Simulink R2024b
- Infineon TLE9879 EVALKIT
- Keil µVision 5 + Infineon Config Wizard
- UART and JTAG interfaces available
The main purpose is to validate control algorithms and measure execution time, not to implement a full HIL system.
Has anyone attempted PIL with a custom or unsupported microcontroller before? Any tips or resources would be greatly appreciated. Thanks in advance!

Hey MATLAB enthusiasts!
I just stumbled upon this hilariously effective GitHub repo for image deformation using Moving Least Squares (MLS)—and it’s pure gold for anyone who loves playing with pixels! 🎨✨
- Real-Time Magic ✨
- Precomputes weights and deformation data upfront, making it blazing fast for interactive edits. Drag control points and watch the image warp like rubber! (2)
- Supports affine, similarity, and rigid deformations—because why settle for one flavor of chaos?
- Single-File Simplicity 🧩
- All packed into one clean MATLAB class (mlsImageWarp.m).
- Endless Fun Use Cases 🤹
- Turn your pet’s photo into a Picasso painting.
- "Fix" your friend’s smile... aggressively.
- Animate static images with silly deformations (1).
Try the Demo!
Hi everyone,
Please check out our new book "Generative AI for Trading and Asset Management".
GenAI is usually associated with large language models (LLMs) like ChatGPT, or with image generation tools like MidJourney, essentially, machines that can learn from text or images and generate text or images. But in reality, these models can learn from many different types of data. In particular, they can learn from time series of asset returns, which is perhaps the most relevant for asset managers.
In our book (amazon.com link), we explore both the practical applications and the fundamental principles of GenAI, with a special focus on how these technologies apply to trading and asset management.
The book is divided into two broad parts:
Part 1 is written by Ernie Chan, noted author of Quantitative Trading, Algorithmic Trading, and Machine Trading. It starts with no-code applications of GenAI for traders and asset managers with little or no coding experience. After that, it takes readers on a whirlwind tour of machine learning techniques commonly used in finance.
Part 2, written by Hamlet, covers the fundamentals and technical details of GenAI, from modeling to efficient inference. This part is for those who want to understand the inner workings of these models and how to adapt them to their own custom data and applications. It’s for anyone who wants to go beyond the high-level use cases, get their hands dirty, and apply, and eventually improve these models in real-world practical applications.
Readers can start with whichever part they want to explore and learn from.
You are not a jedi yet !
20%
We not grant u the rank of master !
0%
Ready are u? What knows u of ready?
0%
May the Force be with you !
80%
5 votes
Sto tentando inutilmente di salvare il valore dell'enegia che consumo ogni giorno nel field5 di questo canale: https://thingspeak.mathworks.com/channels/2851490 , ma inutilemte in quanto vengono visualizzati sempre e solo 2 dati anche se ho impostato days=30. Ho provato ad aumentare a 365 ma senza variazioni. Come mai?
I am deeply honored to announce the official publication of my latest academic volume:
MATLAB for Civil Engineers: From Basics to Advanced Applications
(Springer Nature, 2025).
This work serves as a comprehensive bridge between theoretical civil engineering principles and their practical implementation through MATLAB—a platform essential to the future of computational design, simulation, and optimization in our field.
Structured to serve both academic audiences and practicing engineers, this book progresses from foundational MATLAB programming concepts to highly specialized applications in structural analysis, geotechnical engineering, hydraulic modeling, and finite element methods. Whether you are a student building analytical fluency or a professional seeking computational precision, this volume offers an indispensable resource for mastering MATLAB's full potential in civil engineering contexts.
With rigorously structured examples, case studies, and research-aligned methods, MATLAB for Civil Engineers reflects the convergence of engineering logic with algorithmic innovation—equipping readers to address contemporary challenges with clarity, accuracy, and foresight.
📖 Ideal for:
— Graduate and postgraduate civil engineering students
— University instructors and lecturers seeking a structured teaching companion
— Professionals aiming to integrate MATLAB into complex real-world projects
If you are passionate about engineering resilience, data-informed design, or computational modeling, I invite you to explore the work and share it with your network.
🧠 Let us advance the discipline together through precision, programming, and purpose.

I saw this on Reddit and thought of the past mini-hack contests. We have a few folks here who can do something similar with MATLAB.

I had an error in the web version Matlab, so I exited and came back in, and this boy was plotted.
Bom dia se alguém puder me ajudar, meu código abaixo, não estou conseguintdo conectar o meu Esp8266 ao ThingSpeak, o erro tá na conexão. Estou usando o MicroPython e NodeMCU na plataforma Pytohn o sistema operacional Ubuntu 20
# DHT11 -> ESP8266/ESP32
# 1(Vcc) -> 3v3
# 2(Data) -> GPIO12
# 4(Gnd) -> Gnd
import time, network, machine
from dht import DHT11
from machine import Pin
from umqtt.simple import MQTTClient
print("Iniciando...")
dht = DHT11(Pin(12, Pin.IN, Pin.PULL_UP))
estacao = network.WLAN(network.STA_IF)
estacao.active(True)
estacao.connect('xxxxxxx', 'xxxxxxxxx')
while estacao.isconnected() == False:
machine.idle()
print('Conexao realizada.')
print(estacao.ifconfig())
SERVIDOR = "mqtt.thingspeak.com"
CHANNEL_ID = "XXXXXXXXXXXXXXXXX"
WRITE_API_KEY = "XXXXXXXXXXXXXXXXXXXXX"
topico = "channels/" + CHANNEL_ID + "/publish/" + WRITE_API_KEY
cliente = MQTTClient("umqtt_client", SERVIDOR)
try:
while True:
dht.measure()
temp = dht.temperature()
umid = dht.humidity()
print('Temperatura: %3.1f °C' %temp)
print('Umidade: %3.1f %%' %umid)
conteudo = "field1=" + str(temp) + "&field2=" + str(umid)
print ('Conectando a ThingSpeak...')
cliente.connect()
cliente.publish(topico, conteudo)
cliente.disconnect()
print ('Envio realizado.')
time.sleep(600.0)
except KeyboardInterrupt:
estacao.disconnect()
estacao.active(False)
print("Fim.")
*****************************************************************************************************
No shell aparece como resposta:
MPY: soft reboot
Iniciando...
Conexao realizada.
('192.168.0.23', '255.255.255.0', '192.168.0.1', '8.8.8.8')
Temperatura: 29.0 °C
Umidade: 63.0 %
Conectando a ThingSpeak...
Traceback (most recent call last):
File "<stdin>", line 38, in <module>
File "umqtt/simple.py", line 67, in connect
OSError: -2
linha 38 é cliente.connect()
It seems like the financial news is always saying the stock market is especially volatile now. But is it really? This code will show you the daily variation from the prior day. You can see that the average daily change from one day to the next is 0.69%. So any change in the stock market from the prior day less than about 0.7% or 1% is just normal "noise"/typical variation. You can modify the code to adjust the starting date for the analysis. Data file (Excel workbook) is attached (hopefully - I attached it twice but it's not showing up yet).

% Program to plot the Dow Jones Industrial Average from 1928 to May 2025, and compute the standard deviation.
% Data available for download at https://finance.yahoo.com/quote/%5EDJI/history?p=%5EDJI
% Just set the Time Period, then find and click the download link, but you ned a paid version of Yahoo.
%
% If you have a subscription for Microsoft Office 365, you can also get historical stock prices.
% Reference: https://support.microsoft.com/en-us/office/stockhistory-function-1ac8b5b3-5f62-4d94-8ab8-7504ec7239a8#:~:text=The%20STOCKHISTORY%20function%20retrieves%20historical,Microsoft%20365%20Business%20Premium%20subscription.
% For example put this in an Excel Cell
% =STOCKHISTORY("^DJI", "1/1/2000", "5/10/2025", 0, 1, 0, 1,2,3,4, 5)
% and it will fill out a table in Excel
%====================================================================================================================
clc; % Clear the command window.
close all; % Close all figures (except those of imtool.)
imtool close all; % Close all imtool figures if you have the Image Processing Toolbox.
clear; % Erase all existing variables. Or clearvars if you want.
workspace; % Make sure the workspace panel is showing.
format long g;
format compact;
fontSize = 14;
filename = 'Dow Jones Industrial Index.xlsx';
data = readtable(filename);
% Date,Close,Open,High,Low,Volume
dates = data.Date;
closing = data.Close;
volume = data.Volume;
% Define start date and stop date
startDate = datetime(2011,1,1)
stopDate = dates(end)
selectedDates = dates > startDate;
% Extract those dates:
dates = dates(selectedDates);
closing = closing(selectedDates);
volume = volume(selectedDates);
% Plot Volume
hFigVolume = figure('Name', 'Daily Volume');
plot(dates, volume, 'b-');
grid on;
xticks(startDate:calendarDuration(5,0,0):stopDate)
title('Dow Jones Industrial Average Volume', 'FontSize', fontSize);
hFig = figure('Name', 'Daily Standard Deviation');
subplot(3, 1, 1);
plot(dates, closing, 'b-');
xticks(startDate:calendarDuration(5,0,0):stopDate)
drawnow;
grid on;
caption = sprintf('Dow Jones Industrial Average from %s through %s', dates(1), dates(end));
title(caption, 'FontSize', fontSize);
% Get the average change from one trading day to the next.
diffs = 100 * abs(closing(2:end) - closing(1:end-1)) ./ closing(1:end-1);
subplot(3, 1, 2);
averageDailyChange = mean(diffs)
% Looks pretty noisy so let's smooth it for a nicer display.
numWeeks = 4;
diffs = sgolayfilt(diffs, 2, 5*numWeeks+1);
plot(dates(2:end), diffs, 'b-');
grid on;
xticks(startDate:calendarDuration(5,0,0):stopDate)
hold on;
line(xlim, [averageDailyChange, averageDailyChange], 'Color', 'r', 'LineWidth', 2);
ylabel('Percentage', 'FontSize', fontSize);
caption = sprintf('Day-to-Day Change Percentage. Average Daily Change (from prior day) = %.2f%%', averageDailyChange);
title(caption, 'FontSize', fontSize);
drawnow;
% Get the stddev over a 5 trading day window.
sd = stdfilt(closing, ones(5, 1));
% Get it relative to the magnitude.
sd = sd ./ closing * 100;
averageVariation = mean(sd)
numWeeks = 2;
% Looks pretty noisy so let's smooth it for a nicer display.
sd = sgolayfilt(sd, 2, 5*numWeeks+1);
% Plot it.
subplot(3, 1, 3);
plot(dates, sd, 'b-');
grid on;
xticks(startDate:calendarDuration(5,0,0):stopDate)
hold on;
line(xlim, [averageVariation, averageVariation], 'Color', 'r', 'LineWidth', 2);
ylabel('Percentage', 'FontSize', fontSize);
caption = sprintf('Weekly Standard Deviation, Averaged Over %d Weeks (%d trading days). Mean SD = %.2f', ...
numWeeks, 5*numWeeks+1, averageVariation);
title(caption, 'FontSize', fontSize);
% Maximize figure window.
g = gcf;
g.WindowState = 'maximized';
I want to use Simulink for model-based development of the TC3XX series development board, but I am not sure about the development process and toolchain? Is there a free toolchain available for me to use? Do you have a detailed development tutorial?
I have a pressure vs. time plot resulting from the input of an elastic wave, which I obtained from an Abaqus simulation. So, I have access to all the data. Now, I want to convert this time-domain graph into a frequency-domain graph using FFT in MATLAB.
I came across a code through ChatGPT, but I’m not fully confident in relying on it. Could anyone kindly clarify whether the formulas used for FFT in MATLAB are universal for all types of signals? Or is there a more effective and reliable method I should consider for this purpose?
Hi guys!
Im doing a project where i need to simulate a ship connected to the grid. I have a grid->converter AC-DC-AC -> dynamic load. My converter has to keep the voltage consistent and what changes is the current. Can somebody help me?
I wanted to turn a Markdown nested list of text labels:
- A
- B
- C
- D
- G
- H
- E
- F
- Q
into a directed graph, like this:

Here is my blog post with some related tips for doing this, including text I/O, text processing with patterns, and directed graph operations and visualization.
The topic recently came up in a MATLAB Central Answers forum thread, where community members discussed how to programmatically control when the end user can close a custom app. Imagine you need to prevent app closure during a critical process but want to allow the end user to close the app afterwards. This article will guide you through the steps to add this behavior to your app.
A demo is attached containing an app with a state button that, when enabled, disables the ability to close the app.
Steps
1. Add a property that stores the state of the closure as a scalar logical value. In this example, I named the property closeEnabled. The default value in this example is true, meaning that closing is enabled. -- How to add a property to an app in app designer
properties (Access = private)
closeEnabled = true % Flag that controls ability to close app
end
2. Add a CloseRequest function to the app figure. This function is called any time there is an attempt to close the app. Within the CloseRequest function, add a condition that deletes the app when closure is enabled. -- How to add a CloseRequest function to an app figure in app designer
function UIFigureCloseRequest(app, event)
if app.closeEnabled
delete(app)
end
3. Toggle the value of the closeEnabled property as needed in your code. Imagine you have a "Process" button that initiates a process where it is crucial for the app to remain open. Set the closeEnabled flag to false (closure is disabled) at the beginning of the button's callback function and then set it to true at the end (closure is enabled).
function ProcessButtonPress(app, event)
app.closeEnabled = false;
% MY PROCESS CODE
app.closeEnabled = true;
end
Handling Errors: There is one trap to keep in mind in the example above. What if something in the callback function breaks before the app.closeEnabled is returned to true? That leaves the app in a bad state where closure is blocked. A pro move would be to use a cleanupObj to manage returning the property to true. In the example below, the task to return the closeEnabled property to true is managed by the cleanup object, which will execute that command when execution is terminated in the ProcessButtonPress function—whether execution was terminated by error or by gracefully exiting the function.
function ProcessButtonPress(app, event)
app.closeEnabled = false;
cleanupClosure = onCleanup(@()set(app,'closeEnabled',true));
% MY CODE
end
Force Closure: If the CloseRequest function is preventing an app from closing, here are a couple of ways to force a closure.
- If you have the app's handle, use delete(app) or close(app,'force'). This will also work on the app's figure handle.
- If you do not have the app's handle, you can use close('all','force') to close all figures or use findall(groot,'type','figure') to find the app's figure handle.
Me: If you have parallel code and you apply this trick that only requires changing one line then it might go faster.
Reddit user: I did and it made my code 3x faster
Not bad for just one line of code!
Which makes me wonder. Could it make your MATLAB program go faster too? If you have some MATLAB code that makes use of parallel constructs like parfor or parfeval then start up your parallel pool like this
parpool("Threads")
before running your program.
The worst that will happen is you get an error message and you'll send us a bug report....or maybe it doesn't speed up much at all....
....or maybe you'll be like the Reddit user and get 3x speed-up for 10 seconds work. It must be worth a try...after all, you're using parallel computing to make your code faster right? May as well go all the way.
In an artificial benchmark I tried, I got 10x speedup! More details in my recent blog post: Parallel computing in MATLAB: Have you tried ThreadPools yet? » The MATLAB Blog - MATLAB & Simulink
Give it a try and let me know how you get on.
I am pleased to announce the 6th Edition of my book MATLAB Recipes for Earth Sciences with Springer Nature
also in the MathWorks Book Program
It is now almost exactly 20 years since I signed the contract with Springer for the first edition of the book. Since then, the book has grown from 237 to 576 pages, with many new chapters added. I would like to thank my colleagues Norbert Marwan and Robin Gebbers, who have each contributed two sections to Chapters 5, 7 and 9.
And of course, my thanks go to the excellent team at the MathWorks Book Program and the numerous other MathWorks experts who have helped and advised me during the last 30+ years working with MATLAB. And of course, thank you Springer for 20 years of support.
This book introduces methods of data analysis in the earth sciences using MATLAB, such as basic statistics for univariate, bivariate, and multivariate data sets, time series analysis, signal processing, spatial and directional data analysis, and image analysis.
Martin H. Trauth

Hello ThingSpeak Community,
I have an energy meter sending data of energy consumed in 4 rooms in hexadecimal values to Sigfox and I was trying to decode the payload and route it to ThingSpeak.
All the datas are sent at the same time.
But ThingSpeak only receives 1 of them and plots them.
However, the rest 3 are missing. Is this because I am trying the free version ?
Would the payed version be capable of receiving all the 4 messages ?