549 results
Learn Fourier analysis using live scripts and apps.
Model 2-d surfaces from scattered data
Simply plot national and US state boundaries, with or without Matlab's Mapping Toolbox.
Plots 3d polar data with polar axis and polar grid
polarPcolor draws a pseudocolor plot in polar coordinates with a polar grid.
This function is able to define a customized colormap given the positions and the colors that are required to make the gradients.
Convert values given by a contour matrix to easy-to-use cells.
Learn how to deploy an algorithm to an FPGA using MATLAB and Simulink.
Simply plot filled circles or circle outlines.
Create JavaScript and WebAssembly apps and libraries from MATLAB projects using MATLAB Coder.
Example files for MATLAB and Simulink Robotics Arena walking robot videos.
Explore data and use machine learning to predict the damage costs of storm events based on location, time of year, and type of event
MATLAB and Simulink utilities for vehicle kinematics, visualization, and sensor simulation.
A toolbox for analysis and display of Antarctica-related data
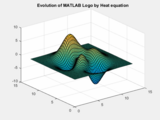
Simple Heat Equation solver using finite difference method
Compatibility Support for Widgets Toolbox content built before to R2020b
You can learn how to detect and localize anomalies on image using Convolutional Auto Encoder.
Interpolate over small gaps in x, but not over large gaps in x.
A toolbox for developing custom toolboxes in MATLAB.
Create a gridded lookup table of scattered data in n dimensions.
Create a title for a figure with multiple subplots.
Estimates the parameters of an affine (first-order) optic flow model from two images.
MATLAB and Simulink support for hardware components used in the Arduino Engineering Kit.
A three-variate spatially correlated turbulent wind field is simulated in three dimensions.
Draw a very simple 3D airplane and animate it too
Linear plot, with extra functionality for area filling.
The modal parameters of a line-like structure are estimated in the time domain using displacement records only.
Scrape one or more numbers off of a web page
This example is explaining how to import or export different data types for MATLAB function in Visual Studio
A Hough transform function for detecting circles, optimised to allow search over radii.
A MATLAB program for the analysis of digital elevation models
Heart Sound Classification demo as explained in the Machine Learning eBook, but now expanded to demonstrate Wavelet scattering
Creation of fractal curves, surfaces, & volumetric density as well as techniques to measure 1D, 2D, and 3D fractal dimension and fractalness
Convert colors between rgb and hex values
Heat conduction in a magnesium robotics component with finite element analysis (FEA).
Performance of various Kernels for SVM classification
On-line support vector regression (using Gaussian kernel)
How to create and train a V-Net neural network and perform semantic segmentation of lung tumors from 3-D medical images
Predictive maintenance algorithm developed using digital twin of hydraulic pump modeled in Simscape
A constant-lightness cyclic colormap for phase.
Return cell array of tables from HTML page.
A complete MEaSUREs grounding line, coast line, and mask dataset from Mouginot et al.
Computes nearest neighbour(s) by Euclidean distance
Get Bedmap2 data into Matlab. Several tools for data access, interpolation, and plotting.
Fit ellipses to 2D points using linear or nonlinear least squares
The MATLAB function pixelgrid shows the edges of image pixels.
ribboncoloredZ() is a wrapper of built-in ribbon() with coloring ribbons according to Z values
Replace or delete values in a surface farther than a given distance from points.
Fit an annual sinusoid to data using a least-squares approximation.
Simply create horizontal or vertical shaded sections of a plot.
Matrix approach to discretization of ODEs and PDEs of arbitrary real order
Version 1.13.0.0
Igor PodlubnyFunctions illustrating matrix approach to discretization of ODEs / PDEs with fractional derivatives.
YahooFinance/Quandl data downloader
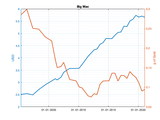
Visualization and analysis of an Electrocardiogram Signal
Version 1.0.0
Constantino Carlos Reyes-AldasoroLive Script shows how to find data peaks from EKG, how to refine peaks from data, and infer heart rate from peaks of Electrocardiogram data
Models VAR using GDP for Malaysia, GDP for U.S. and Malaysia/U.S. Foreign Exchange Rate
SVM on (Non-linearly Seperable Data) using polynomial Kernel
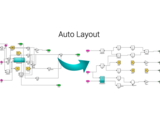
The Auto Layout Tool is used to automatically improve the layout of Simulink models.
Download code and watch video series to learn and implement deep learning techniques
Import Deep Neural Networks Trained in the Darknet Framework
Example files for performing sensor fusion on sensor data sampled from a mobile device.
This interactive MATLAB document covers concepts relating to chemical kinetics and reaction rates.


