rfckt.amplifier
Create RF Amplifier
Description
Use the rfckt.amplifier object to represent RF amplifiers
that are characterized by network parameters, noise data, and nonlinear data
Note
amplifier
is recommend over rfckt.amplifier because it enables you to:
Create a two-port amplifier element.
Analyze a commercial off-the-shelf (COTS) amplifier.
Build a
circuitobject with an amplifier element.Characterize amplifiers using AM/AM-AM/PM data. (since R2023b)
Model an amplifier in an RF chain created using an
rfbudgetobject or the RF Budget Analyzer app, and then export this element to RF Blockset™ or torfsystemSystem object™ for circuit envelope analysis.
(since R2023b)
Use the read object function to read the amplifier
data from a data file in one of the following formats:
Touchstone
Agilent® P2D
Agilent S2D
AMP
Note
If you set NonLinearData using rfdata.ip3 or
rfdata.power, then the property is converted from scalar OIP3
format to the format of rfdata.ip3 or
rfdata.power.
Creation
Description
h = rfckt.amplifier returns an amplifier circuit
object whose properties all have their default values.
h = rfckt.amplifier(Name=Value) sets properties using
one or more name-value arguments. For example,
rfckt.amplifier(IntpType="Cubic") creates an RF
amplifier circuit that uses cubic interpolation. You can specify multiple
name-value pairs. Properties not specified retain their default
values.
Properties
Object Functions
analyze | Analyze RFCKT object in frequency domain |
calculate | Calculate specified parameters for rfckt objects or rfdata objects |
circle | Draw circles on Smith Chart |
extract | Extract specified network parameters from rfckt object or data object |
listformat | List valid formats for specified circuit object parameter |
listparam | List valid parameters for specified circuit object |
loglog | Plot specified circuit object parameters using log-log scale |
plot | Plot circuit object parameters on X-Y plane |
plotyy | Plot parameters of RF circuit or RF data on xy-plane with two Y-axes |
getop | Display operating conditions |
polar | Plot specified object parameters on polar coordinates |
semilogx | Plot RF circuit object parameters using log scale for x-axis |
semilogy | Plot RF circuit object parameters using log scale for y-axis |
smith | Plot circuit object parameters on Smith Chart |
write | Write RF data from circuit or data object to file |
getz0 | Calculate characteristic impedance of RFCKT transmission line object |
read | Read RF data from file to new or existing circuit or data object |
restore | Restore data to original frequencies |
getop | Display operating conditions |
groupdelay | Group delay of S-parameter, RF filter, or RF Toolbox circuit object |
Examples
Algorithms
The analyze function computes the AnalyzedResult
property using the data stored in the rfckt.amplifier object
properties as follows:
The
analyzefunction uses the data stored in theNoiseDataproperty of therfckt.amplifierobject to calculate the noise figure.The
analyzefunction uses the data stored in theNonlinearDataproperty of therfckt.amplifierobject to calculate OIP3.If power data exists in the
NonlinearDataproperty, the block extracts the AM/AM and AM/PM nonlinearities from the power data.If the
NonlinearDataproperty contains only IP3 data, the method computes and adds the nonlinearity by:Using the third-order input intercept point value in dBm to compute the factor, f, that scales the input signal before the amplifier object applies the nonlinearity:
Computing the scaled input signal by multiplying the amplifier input signal by f.
Limiting the scaled input signal to a maximum value of 1.
Applying an AM/AM conversion to the amplifier gain, according to the following cubic polynomial equation:
where u is the magnitude of the scaled input signal, which is a unitless normalized input voltage.
The
analyzefunction uses the data stored in the'NetworkData'property of therfckt.amplifierobject to calculate the group delay values of the amplifier at the frequencies specified infreq, as described in theanalyzefunction reference page.The
analyzefunction uses the data stored in theNetworkDataproperty of therfckt.amplifierobject to calculate the S-parameter values of the amplifier at the frequencies specified infreq. If theNetworkDataproperty contains network Y-parameters or Z-parameters, theanalyzefunction first converts the parameters to S-parameters. Using the interpolation method you specify with theIntpTypeproperty, theanalyzemethod interpolates the S-parameter values to determine their values at the specified frequencies.Specifically, the
analyzefunction orders the S-parameters according to the ascending order of their frequencies, fn. It then interpolates the S-parameters, using the MATLAB®interp1function. For example, the curve in the following diagram illustrates the result of interpolating the S11 parameters at five different frequencies.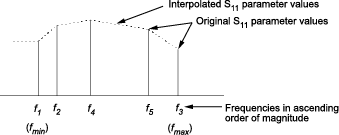
For more information, see “One-Dimensional Interpolation” and the
interp1reference page.As shown in the preceding diagram, the
analyzefunction uses the parameter values at fmin, the minimum input frequency, for all frequencies smaller than fmin. It uses the parameters values at fmax, the maximum input frequency, for all frequencies greater than fmax. In both cases, the results may not be accurate, so you need to specify network parameter values over a range of frequencies that is wide enough to account for the amplifier behavior.
References
[1] EIA/IBIS Open Forum. Touchstone File Format Specification, Rev. 1.1, 2002 (https://ibis.org/connector/touchstone_spec11.pdf).
Version History
Introduced before R2006a